Immigrants from Switzerland vs Tongan 7th Grade
COMPARE
Immigrants from Switzerland
Tongan
7th Grade
7th Grade Comparison
Immigrants from Switzerland
Tongans
96.5%
7TH GRADE
94.5/ 100
METRIC RATING
124th/ 347
METRIC RANK
95.4%
7TH GRADE
1.3/ 100
METRIC RATING
247th/ 347
METRIC RANK
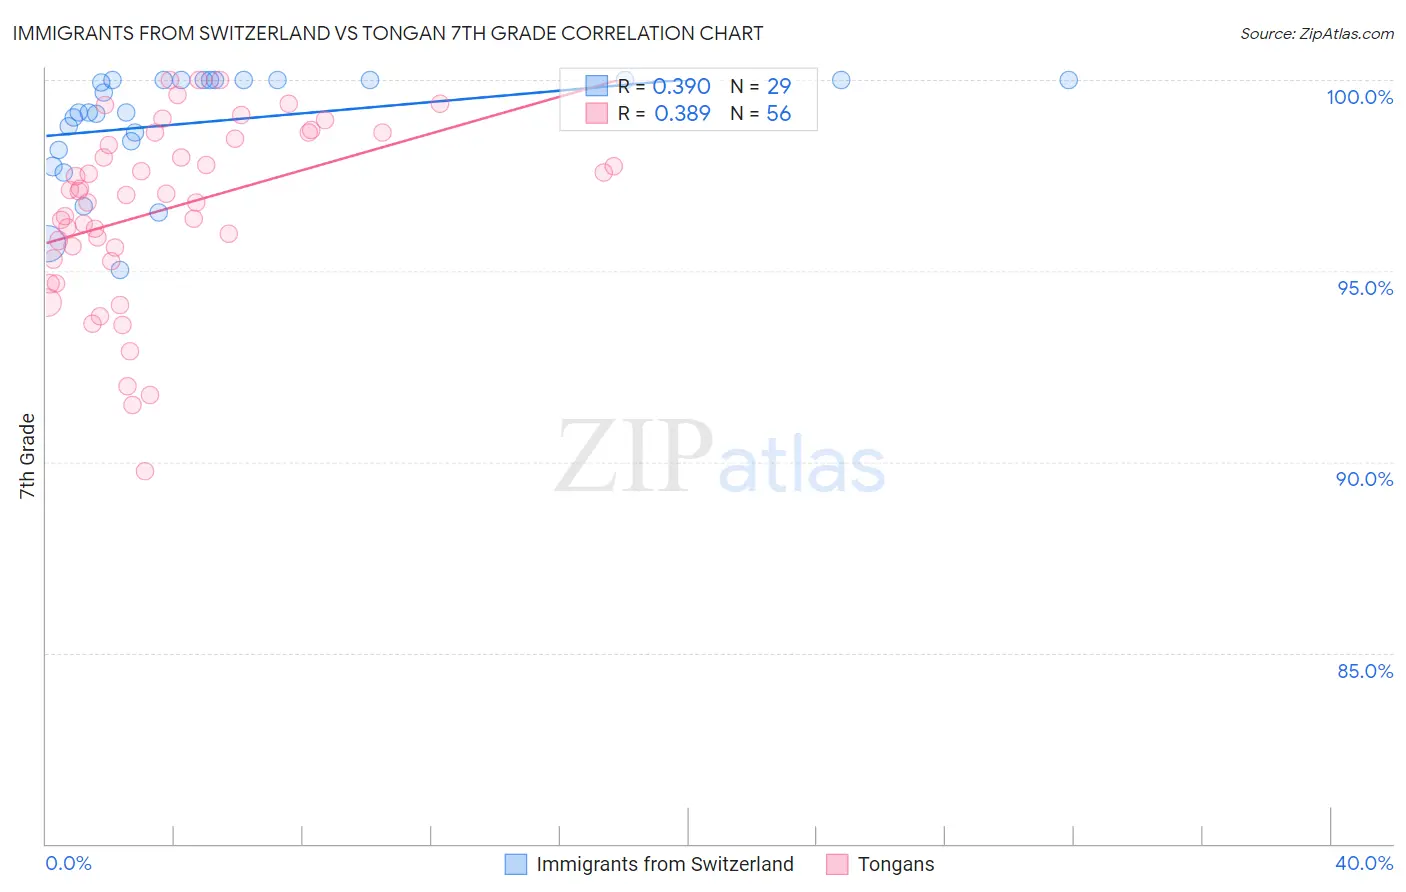
Immigrants from Switzerland vs Tongan 7th Grade Correlation Chart
The statistical analysis conducted on geographies consisting of 148,082,451 people shows a mild positive correlation between the proportion of Immigrants from Switzerland and percentage of population with at least 7th grade education in the United States with a correlation coefficient (R) of 0.390 and weighted average of 96.5%. Similarly, the statistical analysis conducted on geographies consisting of 102,873,790 people shows a mild positive correlation between the proportion of Tongans and percentage of population with at least 7th grade education in the United States with a correlation coefficient (R) of 0.389 and weighted average of 95.4%, a difference of 1.1%.
7th Grade Correlation Summary
| Measurement | Immigrants from Switzerland | Tongan |
| Minimum | 95.0% | 89.7% |
| Maximum | 100.0% | 100.0% |
| Range | 5.0% | 10.3% |
| Mean | 98.9% | 96.6% |
| Median | 99.2% | 97.0% |
| Interquartile 25% (IQ1) | 98.3% | 95.5% |
| Interquartile 75% (IQ3) | 100.0% | 98.5% |
| Interquartile Range (IQR) | 1.7% | 3.1% |
| Standard Deviation (Sample) | 1.4% | 2.3% |
| Standard Deviation (Population) | 1.4% | 2.3% |
Similar Demographics by 7th Grade
Demographics Similar to Immigrants from Switzerland by 7th Grade
In terms of 7th grade, the demographic groups most similar to Immigrants from Switzerland are Cheyenne (96.5%, a difference of 0.010%), Immigrants from Europe (96.5%, a difference of 0.010%), Immigrants from France (96.5%, a difference of 0.010%), Immigrants from Bulgaria (96.4%, a difference of 0.010%), and Immigrants from Norway (96.5%, a difference of 0.020%).
| Demographics | Rating | Rank | 7th Grade |
| Immigrants | Moldova | 95.7 /100 | #117 | Exceptional 96.5% |
| Immigrants | Japan | 95.5 /100 | #118 | Exceptional 96.5% |
| Immigrants | Norway | 95.2 /100 | #119 | Exceptional 96.5% |
| Immigrants | Croatia | 95.0 /100 | #120 | Exceptional 96.5% |
| Cheyenne | 94.9 /100 | #121 | Exceptional 96.5% |
| Immigrants | Europe | 94.8 /100 | #122 | Exceptional 96.5% |
| Immigrants | France | 94.7 /100 | #123 | Exceptional 96.5% |
| Immigrants | Switzerland | 94.5 /100 | #124 | Exceptional 96.5% |
| Immigrants | Bulgaria | 94.0 /100 | #125 | Exceptional 96.4% |
| Palestinians | 93.5 /100 | #126 | Exceptional 96.4% |
| Immigrants | Bosnia and Herzegovina | 93.3 /100 | #127 | Exceptional 96.4% |
| Immigrants | Romania | 93.2 /100 | #128 | Exceptional 96.4% |
| Immigrants | North Macedonia | 93.1 /100 | #129 | Exceptional 96.4% |
| Immigrants | Serbia | 92.8 /100 | #130 | Exceptional 96.4% |
| Filipinos | 92.1 /100 | #131 | Exceptional 96.4% |
Demographics Similar to Tongans by 7th Grade
In terms of 7th grade, the demographic groups most similar to Tongans are Ethiopian (95.4%, a difference of 0.020%), Paiute (95.4%, a difference of 0.020%), Uruguayan (95.4%, a difference of 0.030%), Immigrants from Middle Africa (95.4%, a difference of 0.030%), and Bolivian (95.4%, a difference of 0.030%).
| Demographics | Rating | Rank | 7th Grade |
| Immigrants | Sierra Leone | 2.0 /100 | #240 | Tragic 95.5% |
| South American Indians | 2.0 /100 | #241 | Tragic 95.5% |
| Immigrants | Senegal | 1.9 /100 | #242 | Tragic 95.5% |
| U.S. Virgin Islanders | 1.6 /100 | #243 | Tragic 95.4% |
| Uruguayans | 1.6 /100 | #244 | Tragic 95.4% |
| Immigrants | Middle Africa | 1.5 /100 | #245 | Tragic 95.4% |
| Ethiopians | 1.5 /100 | #246 | Tragic 95.4% |
| Tongans | 1.3 /100 | #247 | Tragic 95.4% |
| Paiute | 1.2 /100 | #248 | Tragic 95.4% |
| Bolivians | 1.1 /100 | #249 | Tragic 95.4% |
| Immigrants | Cameroon | 0.9 /100 | #250 | Tragic 95.4% |
| Immigrants | Jamaica | 0.9 /100 | #251 | Tragic 95.4% |
| Immigrants | Ethiopia | 0.9 /100 | #252 | Tragic 95.3% |
| Somalis | 0.9 /100 | #253 | Tragic 95.3% |
| Colombians | 0.8 /100 | #254 | Tragic 95.3% |