Immigrants from Switzerland vs African 7th Grade
COMPARE
Immigrants from Switzerland
African
7th Grade
7th Grade Comparison
Immigrants from Switzerland
Africans
96.5%
7TH GRADE
94.5/ 100
METRIC RATING
124th/ 347
METRIC RANK
95.8%
7TH GRADE
17.6/ 100
METRIC RATING
206th/ 347
METRIC RANK
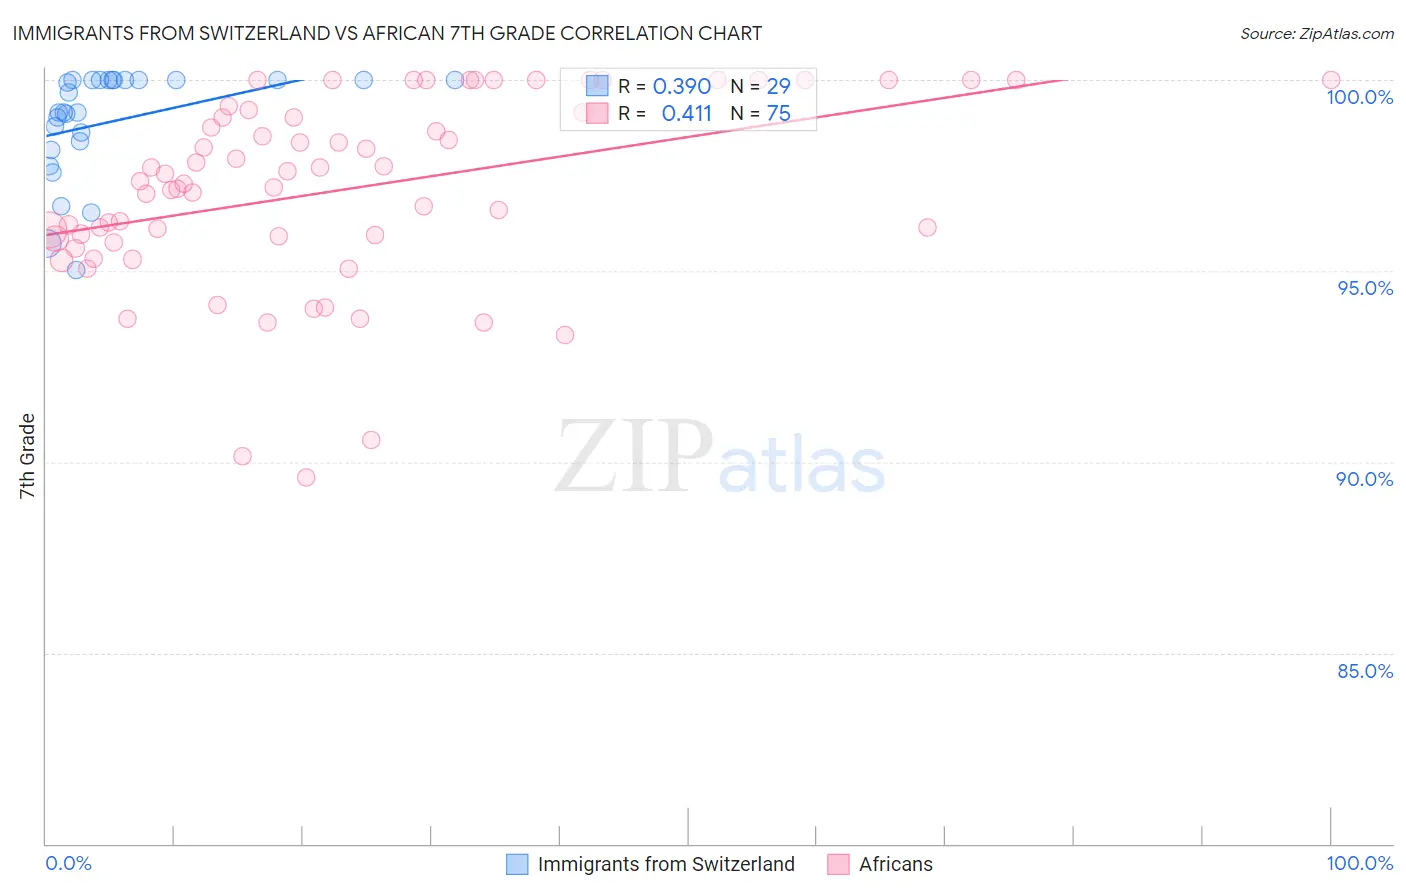
Immigrants from Switzerland vs African 7th Grade Correlation Chart
The statistical analysis conducted on geographies consisting of 148,082,451 people shows a mild positive correlation between the proportion of Immigrants from Switzerland and percentage of population with at least 7th grade education in the United States with a correlation coefficient (R) of 0.390 and weighted average of 96.5%. Similarly, the statistical analysis conducted on geographies consisting of 470,094,744 people shows a moderate positive correlation between the proportion of Africans and percentage of population with at least 7th grade education in the United States with a correlation coefficient (R) of 0.411 and weighted average of 95.8%, a difference of 0.67%.
7th Grade Correlation Summary
| Measurement | Immigrants from Switzerland | African |
| Minimum | 95.0% | 89.6% |
| Maximum | 100.0% | 100.0% |
| Range | 5.0% | 10.4% |
| Mean | 98.9% | 97.1% |
| Median | 99.2% | 97.3% |
| Interquartile 25% (IQ1) | 98.3% | 95.9% |
| Interquartile 75% (IQ3) | 100.0% | 99.2% |
| Interquartile Range (IQR) | 1.7% | 3.4% |
| Standard Deviation (Sample) | 1.4% | 2.5% |
| Standard Deviation (Population) | 1.4% | 2.5% |
Similar Demographics by 7th Grade
Demographics Similar to Immigrants from Switzerland by 7th Grade
In terms of 7th grade, the demographic groups most similar to Immigrants from Switzerland are Cheyenne (96.5%, a difference of 0.010%), Immigrants from Europe (96.5%, a difference of 0.010%), Immigrants from France (96.5%, a difference of 0.010%), Immigrants from Bulgaria (96.4%, a difference of 0.010%), and Immigrants from Norway (96.5%, a difference of 0.020%).
| Demographics | Rating | Rank | 7th Grade |
| Immigrants | Moldova | 95.7 /100 | #117 | Exceptional 96.5% |
| Immigrants | Japan | 95.5 /100 | #118 | Exceptional 96.5% |
| Immigrants | Norway | 95.2 /100 | #119 | Exceptional 96.5% |
| Immigrants | Croatia | 95.0 /100 | #120 | Exceptional 96.5% |
| Cheyenne | 94.9 /100 | #121 | Exceptional 96.5% |
| Immigrants | Europe | 94.8 /100 | #122 | Exceptional 96.5% |
| Immigrants | France | 94.7 /100 | #123 | Exceptional 96.5% |
| Immigrants | Switzerland | 94.5 /100 | #124 | Exceptional 96.5% |
| Immigrants | Bulgaria | 94.0 /100 | #125 | Exceptional 96.4% |
| Palestinians | 93.5 /100 | #126 | Exceptional 96.4% |
| Immigrants | Bosnia and Herzegovina | 93.3 /100 | #127 | Exceptional 96.4% |
| Immigrants | Romania | 93.2 /100 | #128 | Exceptional 96.4% |
| Immigrants | North Macedonia | 93.1 /100 | #129 | Exceptional 96.4% |
| Immigrants | Serbia | 92.8 /100 | #130 | Exceptional 96.4% |
| Filipinos | 92.1 /100 | #131 | Exceptional 96.4% |
Demographics Similar to Africans by 7th Grade
In terms of 7th grade, the demographic groups most similar to Africans are Moroccan (95.8%, a difference of 0.010%), Navajo (95.8%, a difference of 0.010%), Immigrants from Sudan (95.8%, a difference of 0.010%), Dutch West Indian (95.8%, a difference of 0.020%), and Hawaiian (95.8%, a difference of 0.020%).
| Demographics | Rating | Rank | 7th Grade |
| Guamanians/Chamorros | 23.5 /100 | #199 | Fair 95.9% |
| Argentineans | 23.2 /100 | #200 | Fair 95.9% |
| Immigrants | Argentina | 21.9 /100 | #201 | Fair 95.9% |
| Immigrants | Northern Africa | 21.4 /100 | #202 | Fair 95.8% |
| Comanche | 21.1 /100 | #203 | Fair 95.8% |
| Assyrians/Chaldeans/Syriacs | 20.5 /100 | #204 | Fair 95.8% |
| Moroccans | 18.9 /100 | #205 | Poor 95.8% |
| Africans | 17.6 /100 | #206 | Poor 95.8% |
| Navajo | 17.0 /100 | #207 | Poor 95.8% |
| Immigrants | Sudan | 17.0 /100 | #208 | Poor 95.8% |
| Dutch West Indians | 16.1 /100 | #209 | Poor 95.8% |
| Hawaiians | 16.0 /100 | #210 | Poor 95.8% |
| Portuguese | 13.6 /100 | #211 | Poor 95.8% |
| Immigrants | Lebanon | 13.0 /100 | #212 | Poor 95.8% |
| Immigrants | Morocco | 12.6 /100 | #213 | Poor 95.8% |