Immigrants from Switzerland vs Somali 9th Grade
COMPARE
Immigrants from Switzerland
Somali
9th Grade
9th Grade Comparison
Immigrants from Switzerland
Somalis
95.5%
9TH GRADE
97.7/ 100
METRIC RATING
102nd/ 347
METRIC RANK
94.3%
9TH GRADE
2.9/ 100
METRIC RATING
236th/ 347
METRIC RANK
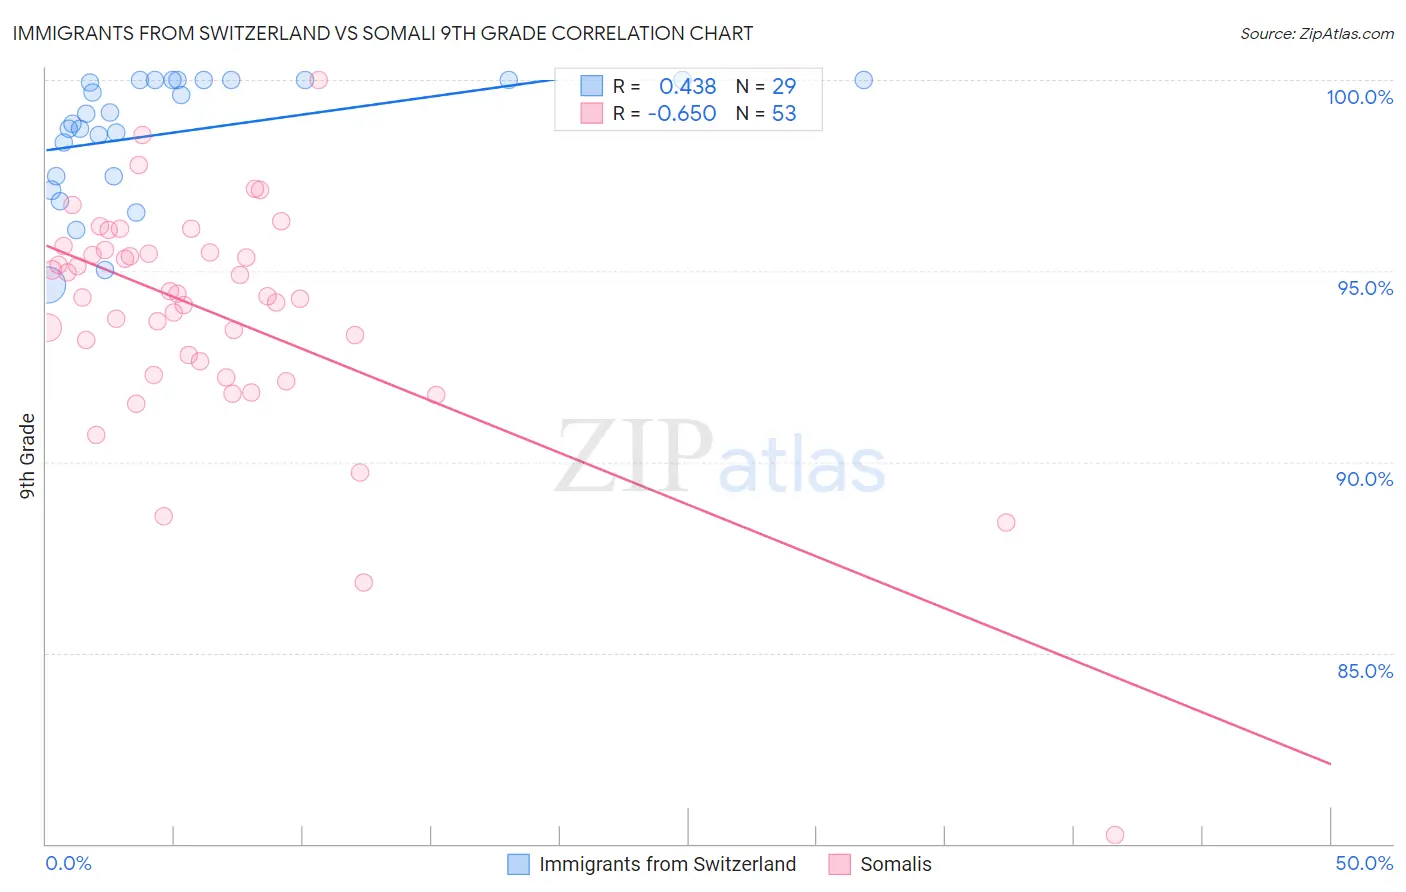
Immigrants from Switzerland vs Somali 9th Grade Correlation Chart
The statistical analysis conducted on geographies consisting of 148,082,451 people shows a moderate positive correlation between the proportion of Immigrants from Switzerland and percentage of population with at least 9th grade education in the United States with a correlation coefficient (R) of 0.438 and weighted average of 95.5%. Similarly, the statistical analysis conducted on geographies consisting of 99,330,527 people shows a significant negative correlation between the proportion of Somalis and percentage of population with at least 9th grade education in the United States with a correlation coefficient (R) of -0.650 and weighted average of 94.3%, a difference of 1.3%.
9th Grade Correlation Summary
| Measurement | Immigrants from Switzerland | Somali |
| Minimum | 94.6% | 80.2% |
| Maximum | 100.0% | 100.0% |
| Range | 5.4% | 19.8% |
| Mean | 98.6% | 93.9% |
| Median | 99.1% | 94.4% |
| Interquartile 25% (IQ1) | 97.5% | 92.5% |
| Interquartile 75% (IQ3) | 100.0% | 95.5% |
| Interquartile Range (IQR) | 2.5% | 3.1% |
| Standard Deviation (Sample) | 1.6% | 3.1% |
| Standard Deviation (Population) | 1.6% | 3.1% |
Similar Demographics by 9th Grade
Demographics Similar to Immigrants from Switzerland by 9th Grade
In terms of 9th grade, the demographic groups most similar to Immigrants from Switzerland are Potawatomi (95.5%, a difference of 0.0%), Immigrants from Moldova (95.5%, a difference of 0.010%), Syrian (95.5%, a difference of 0.030%), Immigrants from France (95.5%, a difference of 0.030%), and Lebanese (95.6%, a difference of 0.040%).
| Demographics | Rating | Rank | 9th Grade |
| Americans | 98.5 /100 | #95 | Exceptional 95.6% |
| Filipinos | 98.5 /100 | #96 | Exceptional 95.6% |
| Delaware | 98.4 /100 | #97 | Exceptional 95.6% |
| Immigrants | Japan | 98.4 /100 | #98 | Exceptional 95.6% |
| Menominee | 98.3 /100 | #99 | Exceptional 95.6% |
| Lebanese | 98.1 /100 | #100 | Exceptional 95.6% |
| Immigrants | Moldova | 97.9 /100 | #101 | Exceptional 95.5% |
| Immigrants | Switzerland | 97.7 /100 | #102 | Exceptional 95.5% |
| Potawatomi | 97.7 /100 | #103 | Exceptional 95.5% |
| Syrians | 97.4 /100 | #104 | Exceptional 95.5% |
| Immigrants | France | 97.4 /100 | #105 | Exceptional 95.5% |
| Immigrants | Norway | 97.1 /100 | #106 | Exceptional 95.5% |
| Immigrants | Zimbabwe | 96.9 /100 | #107 | Exceptional 95.5% |
| Chickasaw | 96.8 /100 | #108 | Exceptional 95.5% |
| Osage | 96.8 /100 | #109 | Exceptional 95.5% |
Demographics Similar to Somalis by 9th Grade
In terms of 9th grade, the demographic groups most similar to Somalis are Korean (94.3%, a difference of 0.0%), South American Indian (94.3%, a difference of 0.010%), Immigrants from China (94.3%, a difference of 0.010%), Bolivian (94.3%, a difference of 0.020%), and Immigrants from Ethiopia (94.3%, a difference of 0.020%).
| Demographics | Rating | Rank | 9th Grade |
| Immigrants | Southern Europe | 4.5 /100 | #229 | Tragic 94.3% |
| Apache | 4.2 /100 | #230 | Tragic 94.3% |
| Immigrants | Panama | 4.0 /100 | #231 | Tragic 94.3% |
| Immigrants | Africa | 3.9 /100 | #232 | Tragic 94.3% |
| Nigerians | 3.7 /100 | #233 | Tragic 94.3% |
| Costa Ricans | 3.5 /100 | #234 | Tragic 94.3% |
| Bolivians | 3.3 /100 | #235 | Tragic 94.3% |
| Somalis | 2.9 /100 | #236 | Tragic 94.3% |
| Koreans | 2.9 /100 | #237 | Tragic 94.3% |
| South American Indians | 2.8 /100 | #238 | Tragic 94.3% |
| Immigrants | China | 2.8 /100 | #239 | Tragic 94.3% |
| Immigrants | Ethiopia | 2.7 /100 | #240 | Tragic 94.3% |
| Spanish Americans | 2.6 /100 | #241 | Tragic 94.2% |
| Immigrants | Middle Africa | 2.2 /100 | #242 | Tragic 94.2% |
| Immigrants | Cameroon | 2.1 /100 | #243 | Tragic 94.2% |