Immigrants from Switzerland vs Norwegian 9th Grade
COMPARE
Immigrants from Switzerland
Norwegian
9th Grade
9th Grade Comparison
Immigrants from Switzerland
Norwegians
95.5%
9TH GRADE
97.7/ 100
METRIC RATING
102nd/ 347
METRIC RANK
96.9%
9TH GRADE
100.0/ 100
METRIC RATING
2nd/ 347
METRIC RANK
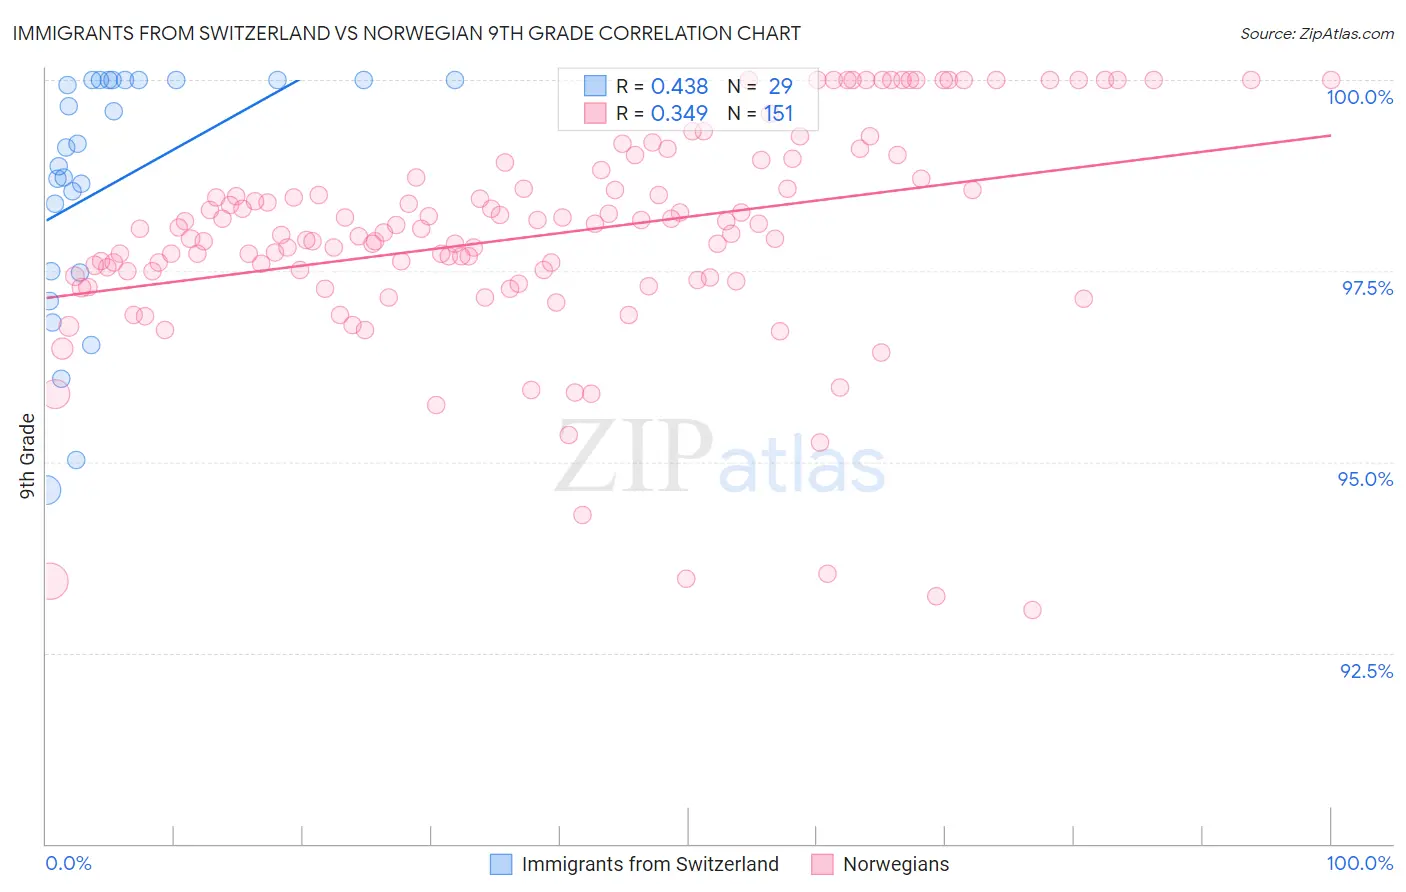
Immigrants from Switzerland vs Norwegian 9th Grade Correlation Chart
The statistical analysis conducted on geographies consisting of 148,082,451 people shows a moderate positive correlation between the proportion of Immigrants from Switzerland and percentage of population with at least 9th grade education in the United States with a correlation coefficient (R) of 0.438 and weighted average of 95.5%. Similarly, the statistical analysis conducted on geographies consisting of 533,395,166 people shows a mild positive correlation between the proportion of Norwegians and percentage of population with at least 9th grade education in the United States with a correlation coefficient (R) of 0.349 and weighted average of 96.9%, a difference of 1.5%.
9th Grade Correlation Summary
| Measurement | Immigrants from Switzerland | Norwegian |
| Minimum | 94.6% | 93.1% |
| Maximum | 100.0% | 100.0% |
| Range | 5.4% | 6.9% |
| Mean | 98.6% | 98.0% |
| Median | 99.1% | 98.0% |
| Interquartile 25% (IQ1) | 97.5% | 97.4% |
| Interquartile 75% (IQ3) | 100.0% | 98.7% |
| Interquartile Range (IQR) | 2.5% | 1.3% |
| Standard Deviation (Sample) | 1.6% | 1.4% |
| Standard Deviation (Population) | 1.6% | 1.4% |
Similar Demographics by 9th Grade
Demographics Similar to Immigrants from Switzerland by 9th Grade
In terms of 9th grade, the demographic groups most similar to Immigrants from Switzerland are Potawatomi (95.5%, a difference of 0.0%), Immigrants from Moldova (95.5%, a difference of 0.010%), Syrian (95.5%, a difference of 0.030%), Immigrants from France (95.5%, a difference of 0.030%), and Lebanese (95.6%, a difference of 0.040%).
| Demographics | Rating | Rank | 9th Grade |
| Americans | 98.5 /100 | #95 | Exceptional 95.6% |
| Filipinos | 98.5 /100 | #96 | Exceptional 95.6% |
| Delaware | 98.4 /100 | #97 | Exceptional 95.6% |
| Immigrants | Japan | 98.4 /100 | #98 | Exceptional 95.6% |
| Menominee | 98.3 /100 | #99 | Exceptional 95.6% |
| Lebanese | 98.1 /100 | #100 | Exceptional 95.6% |
| Immigrants | Moldova | 97.9 /100 | #101 | Exceptional 95.5% |
| Immigrants | Switzerland | 97.7 /100 | #102 | Exceptional 95.5% |
| Potawatomi | 97.7 /100 | #103 | Exceptional 95.5% |
| Syrians | 97.4 /100 | #104 | Exceptional 95.5% |
| Immigrants | France | 97.4 /100 | #105 | Exceptional 95.5% |
| Immigrants | Norway | 97.1 /100 | #106 | Exceptional 95.5% |
| Immigrants | Zimbabwe | 96.9 /100 | #107 | Exceptional 95.5% |
| Chickasaw | 96.8 /100 | #108 | Exceptional 95.5% |
| Osage | 96.8 /100 | #109 | Exceptional 95.5% |
Demographics Similar to Norwegians by 9th Grade
In terms of 9th grade, the demographic groups most similar to Norwegians are Slovak (96.9%, a difference of 0.050%), Tsimshian (97.0%, a difference of 0.090%), Slovene (96.7%, a difference of 0.18%), Swedish (96.7%, a difference of 0.18%), and Polish (96.7%, a difference of 0.19%).
| Demographics | Rating | Rank | 9th Grade |
| Tsimshian | 100.0 /100 | #1 | Exceptional 97.0% |
| Norwegians | 100.0 /100 | #2 | Exceptional 96.9% |
| Slovaks | 100.0 /100 | #3 | Exceptional 96.9% |
| Slovenes | 100.0 /100 | #4 | Exceptional 96.7% |
| Swedes | 100.0 /100 | #5 | Exceptional 96.7% |
| Poles | 100.0 /100 | #6 | Exceptional 96.7% |
| Carpatho Rusyns | 100.0 /100 | #7 | Exceptional 96.7% |
| Germans | 100.0 /100 | #8 | Exceptional 96.7% |
| Tlingit-Haida | 100.0 /100 | #9 | Exceptional 96.6% |
| Lithuanians | 100.0 /100 | #10 | Exceptional 96.6% |
| Finns | 100.0 /100 | #11 | Exceptional 96.6% |
| English | 100.0 /100 | #12 | Exceptional 96.6% |
| Danes | 100.0 /100 | #13 | Exceptional 96.5% |
| Scottish | 100.0 /100 | #14 | Exceptional 96.5% |
| Irish | 100.0 /100 | #15 | Exceptional 96.5% |