Immigrants from St. Vincent and the Grenadines vs Tohono O'odham Associate's Degree
COMPARE
Immigrants from St. Vincent and the Grenadines
Tohono O'odham
Associate's Degree
Associate's Degree Comparison
Immigrants from St. Vincent and the Grenadines
Tohono O'odham
42.9%
ASSOCIATE'S DEGREE
1.9/ 100
METRIC RATING
236th/ 347
METRIC RANK
31.8%
ASSOCIATE'S DEGREE
0.0/ 100
METRIC RATING
343rd/ 347
METRIC RANK
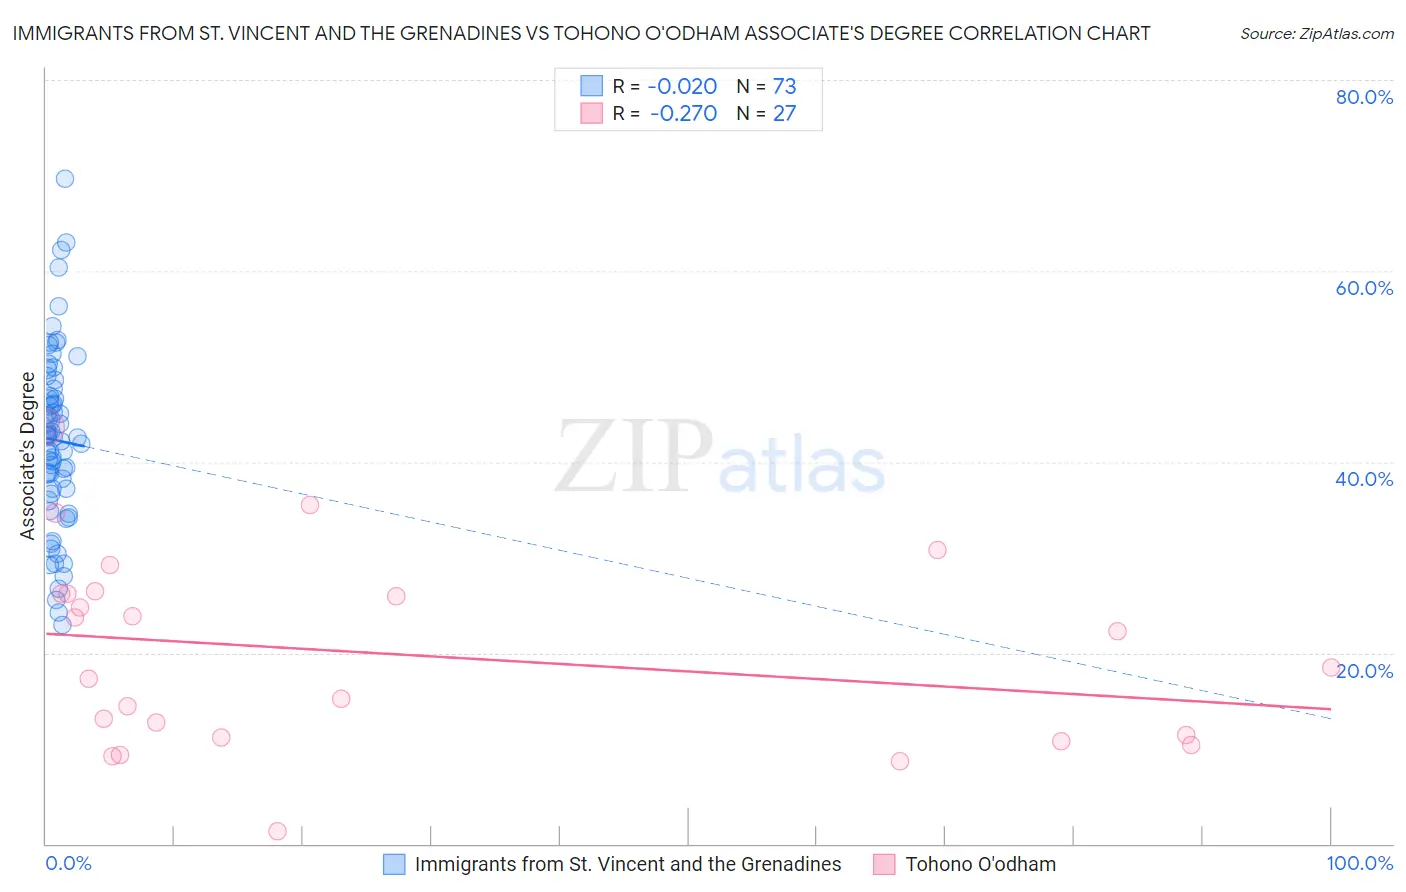
Immigrants from St. Vincent and the Grenadines vs Tohono O'odham Associate's Degree Correlation Chart
The statistical analysis conducted on geographies consisting of 56,191,418 people shows no correlation between the proportion of Immigrants from St. Vincent and the Grenadines and percentage of population with at least associate's degree education in the United States with a correlation coefficient (R) of -0.020 and weighted average of 42.9%. Similarly, the statistical analysis conducted on geographies consisting of 58,725,971 people shows a weak negative correlation between the proportion of Tohono O'odham and percentage of population with at least associate's degree education in the United States with a correlation coefficient (R) of -0.270 and weighted average of 31.8%, a difference of 35.1%.
Associate's Degree Correlation Summary
| Measurement | Immigrants from St. Vincent and the Grenadines | Tohono O'odham |
| Minimum | 23.0% | 1.3% |
| Maximum | 69.7% | 43.7% |
| Range | 46.7% | 42.4% |
| Mean | 42.3% | 19.8% |
| Median | 42.6% | 18.5% |
| Interquartile 25% (IQ1) | 36.9% | 11.2% |
| Interquartile 75% (IQ3) | 47.3% | 26.2% |
| Interquartile Range (IQR) | 10.4% | 15.1% |
| Standard Deviation (Sample) | 9.2% | 10.1% |
| Standard Deviation (Population) | 9.2% | 9.9% |
Similar Demographics by Associate's Degree
Demographics Similar to Immigrants from St. Vincent and the Grenadines by Associate's Degree
In terms of associate's degree, the demographic groups most similar to Immigrants from St. Vincent and the Grenadines are Nonimmigrants (42.9%, a difference of 0.020%), Ecuadorian (43.0%, a difference of 0.080%), Tlingit-Haida (43.0%, a difference of 0.18%), Tongan (43.0%, a difference of 0.27%), and Iroquois (42.8%, a difference of 0.28%).
| Demographics | Rating | Rank | Associate's Degree |
| Immigrants | Trinidad and Tobago | 3.0 /100 | #229 | Tragic 43.3% |
| Immigrants | Barbados | 2.9 /100 | #230 | Tragic 43.3% |
| Liberians | 2.9 /100 | #231 | Tragic 43.3% |
| Native Hawaiians | 2.3 /100 | #232 | Tragic 43.1% |
| Tongans | 2.2 /100 | #233 | Tragic 43.0% |
| Tlingit-Haida | 2.1 /100 | #234 | Tragic 43.0% |
| Ecuadorians | 2.0 /100 | #235 | Tragic 43.0% |
| Immigrants | St. Vincent and the Grenadines | 1.9 /100 | #236 | Tragic 42.9% |
| Immigrants | Nonimmigrants | 1.9 /100 | #237 | Tragic 42.9% |
| Iroquois | 1.7 /100 | #238 | Tragic 42.8% |
| Immigrants | Grenada | 1.3 /100 | #239 | Tragic 42.6% |
| Cree | 1.2 /100 | #240 | Tragic 42.5% |
| British West Indians | 1.0 /100 | #241 | Tragic 42.4% |
| Immigrants | West Indies | 1.0 /100 | #242 | Tragic 42.4% |
| Guyanese | 1.0 /100 | #243 | Tragic 42.3% |
Demographics Similar to Tohono O'odham by Associate's Degree
In terms of associate's degree, the demographic groups most similar to Tohono O'odham are Yuman (31.3%, a difference of 1.7%), Yakama (32.3%, a difference of 1.7%), Inupiat (32.6%, a difference of 2.5%), Navajo (32.6%, a difference of 2.5%), and Pima (30.2%, a difference of 5.1%).
| Demographics | Rating | Rank | Associate's Degree |
| Mexicans | 0.0 /100 | #333 | Tragic 35.0% |
| Natives/Alaskans | 0.0 /100 | #334 | Tragic 34.9% |
| Spanish American Indians | 0.0 /100 | #335 | Tragic 34.9% |
| Hopi | 0.0 /100 | #336 | Tragic 34.6% |
| Lumbee | 0.0 /100 | #337 | Tragic 34.1% |
| Pueblo | 0.0 /100 | #338 | Tragic 34.0% |
| Immigrants | Mexico | 0.0 /100 | #339 | Tragic 33.7% |
| Navajo | 0.0 /100 | #340 | Tragic 32.6% |
| Inupiat | 0.0 /100 | #341 | Tragic 32.6% |
| Yakama | 0.0 /100 | #342 | Tragic 32.3% |
| Tohono O'odham | 0.0 /100 | #343 | Tragic 31.8% |
| Yuman | 0.0 /100 | #344 | Tragic 31.3% |
| Pima | 0.0 /100 | #345 | Tragic 30.2% |
| Houma | 0.0 /100 | #346 | Tragic 28.2% |
| Yup'ik | 0.0 /100 | #347 | Tragic 25.0% |