Immigrants from St. Vincent and the Grenadines vs Icelander Associate's Degree
COMPARE
Immigrants from St. Vincent and the Grenadines
Icelander
Associate's Degree
Associate's Degree Comparison
Immigrants from St. Vincent and the Grenadines
Icelanders
42.9%
ASSOCIATE'S DEGREE
1.9/ 100
METRIC RATING
236th/ 347
METRIC RANK
48.3%
ASSOCIATE'S DEGREE
90.8/ 100
METRIC RATING
131st/ 347
METRIC RANK
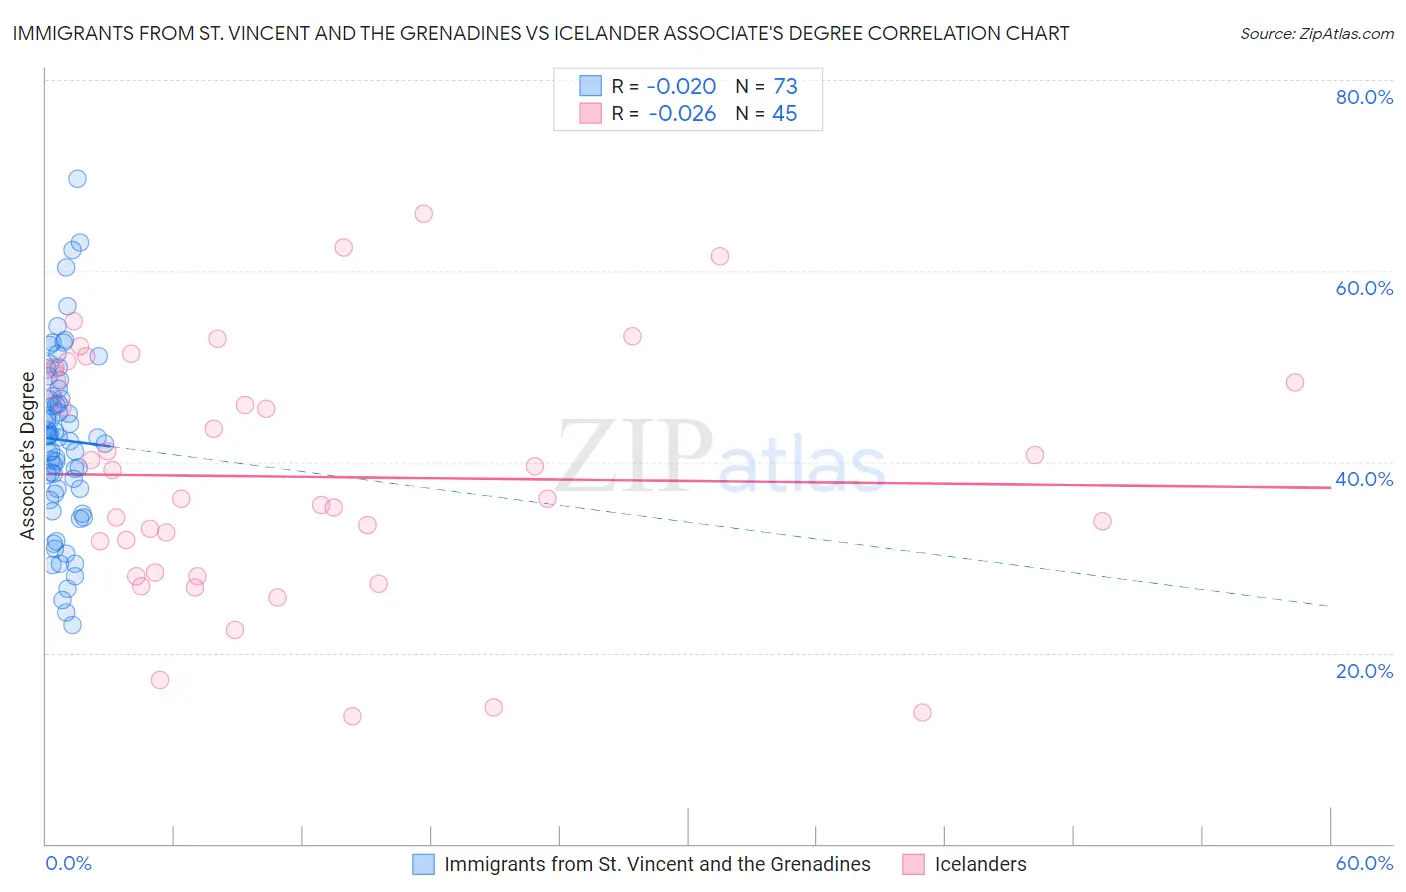
Immigrants from St. Vincent and the Grenadines vs Icelander Associate's Degree Correlation Chart
The statistical analysis conducted on geographies consisting of 56,191,418 people shows no correlation between the proportion of Immigrants from St. Vincent and the Grenadines and percentage of population with at least associate's degree education in the United States with a correlation coefficient (R) of -0.020 and weighted average of 42.9%. Similarly, the statistical analysis conducted on geographies consisting of 159,662,338 people shows no correlation between the proportion of Icelanders and percentage of population with at least associate's degree education in the United States with a correlation coefficient (R) of -0.026 and weighted average of 48.3%, a difference of 12.6%.
Associate's Degree Correlation Summary
| Measurement | Immigrants from St. Vincent and the Grenadines | Icelander |
| Minimum | 23.0% | 13.3% |
| Maximum | 69.7% | 66.0% |
| Range | 46.7% | 52.6% |
| Mean | 42.3% | 38.4% |
| Median | 42.6% | 36.2% |
| Interquartile 25% (IQ1) | 36.9% | 28.2% |
| Interquartile 75% (IQ3) | 47.3% | 49.1% |
| Interquartile Range (IQR) | 10.4% | 20.9% |
| Standard Deviation (Sample) | 9.2% | 13.0% |
| Standard Deviation (Population) | 9.2% | 12.8% |
Similar Demographics by Associate's Degree
Demographics Similar to Immigrants from St. Vincent and the Grenadines by Associate's Degree
In terms of associate's degree, the demographic groups most similar to Immigrants from St. Vincent and the Grenadines are Nonimmigrants (42.9%, a difference of 0.020%), Ecuadorian (43.0%, a difference of 0.080%), Tlingit-Haida (43.0%, a difference of 0.18%), Tongan (43.0%, a difference of 0.27%), and Iroquois (42.8%, a difference of 0.28%).
| Demographics | Rating | Rank | Associate's Degree |
| Immigrants | Trinidad and Tobago | 3.0 /100 | #229 | Tragic 43.3% |
| Immigrants | Barbados | 2.9 /100 | #230 | Tragic 43.3% |
| Liberians | 2.9 /100 | #231 | Tragic 43.3% |
| Native Hawaiians | 2.3 /100 | #232 | Tragic 43.1% |
| Tongans | 2.2 /100 | #233 | Tragic 43.0% |
| Tlingit-Haida | 2.1 /100 | #234 | Tragic 43.0% |
| Ecuadorians | 2.0 /100 | #235 | Tragic 43.0% |
| Immigrants | St. Vincent and the Grenadines | 1.9 /100 | #236 | Tragic 42.9% |
| Immigrants | Nonimmigrants | 1.9 /100 | #237 | Tragic 42.9% |
| Iroquois | 1.7 /100 | #238 | Tragic 42.8% |
| Immigrants | Grenada | 1.3 /100 | #239 | Tragic 42.6% |
| Cree | 1.2 /100 | #240 | Tragic 42.5% |
| British West Indians | 1.0 /100 | #241 | Tragic 42.4% |
| Immigrants | West Indies | 1.0 /100 | #242 | Tragic 42.4% |
| Guyanese | 1.0 /100 | #243 | Tragic 42.3% |
Demographics Similar to Icelanders by Associate's Degree
In terms of associate's degree, the demographic groups most similar to Icelanders are Immigrants from Jordan (48.4%, a difference of 0.10%), Swedish (48.4%, a difference of 0.16%), Immigrants from Albania (48.2%, a difference of 0.18%), Immigrants from Eastern Africa (48.4%, a difference of 0.19%), and Assyrian/Chaldean/Syriac (48.2%, a difference of 0.27%).
| Demographics | Rating | Rank | Associate's Degree |
| Serbians | 92.6 /100 | #124 | Exceptional 48.5% |
| Chinese | 92.5 /100 | #125 | Exceptional 48.5% |
| Immigrants | Syria | 92.2 /100 | #126 | Exceptional 48.5% |
| Immigrants | Uganda | 92.1 /100 | #127 | Exceptional 48.5% |
| Immigrants | Eastern Africa | 91.6 /100 | #128 | Exceptional 48.4% |
| Swedes | 91.5 /100 | #129 | Exceptional 48.4% |
| Immigrants | Jordan | 91.2 /100 | #130 | Exceptional 48.4% |
| Icelanders | 90.8 /100 | #131 | Exceptional 48.3% |
| Immigrants | Albania | 89.9 /100 | #132 | Excellent 48.2% |
| Assyrians/Chaldeans/Syriacs | 89.4 /100 | #133 | Excellent 48.2% |
| Moroccans | 89.3 /100 | #134 | Excellent 48.2% |
| Europeans | 89.0 /100 | #135 | Excellent 48.2% |
| Pakistanis | 88.0 /100 | #136 | Excellent 48.1% |
| Immigrants | Eritrea | 87.8 /100 | #137 | Excellent 48.1% |
| Poles | 87.3 /100 | #138 | Excellent 48.0% |