Immigrants from Sri Lanka vs Menominee Nursery School
COMPARE
Immigrants from Sri Lanka
Menominee
Nursery School
Nursery School Comparison
Immigrants from Sri Lanka
Menominee
98.0%
NURSERY SCHOOL
49.9/ 100
METRIC RATING
175th/ 347
METRIC RANK
98.2%
NURSERY SCHOOL
93.6/ 100
METRIC RATING
126th/ 347
METRIC RANK
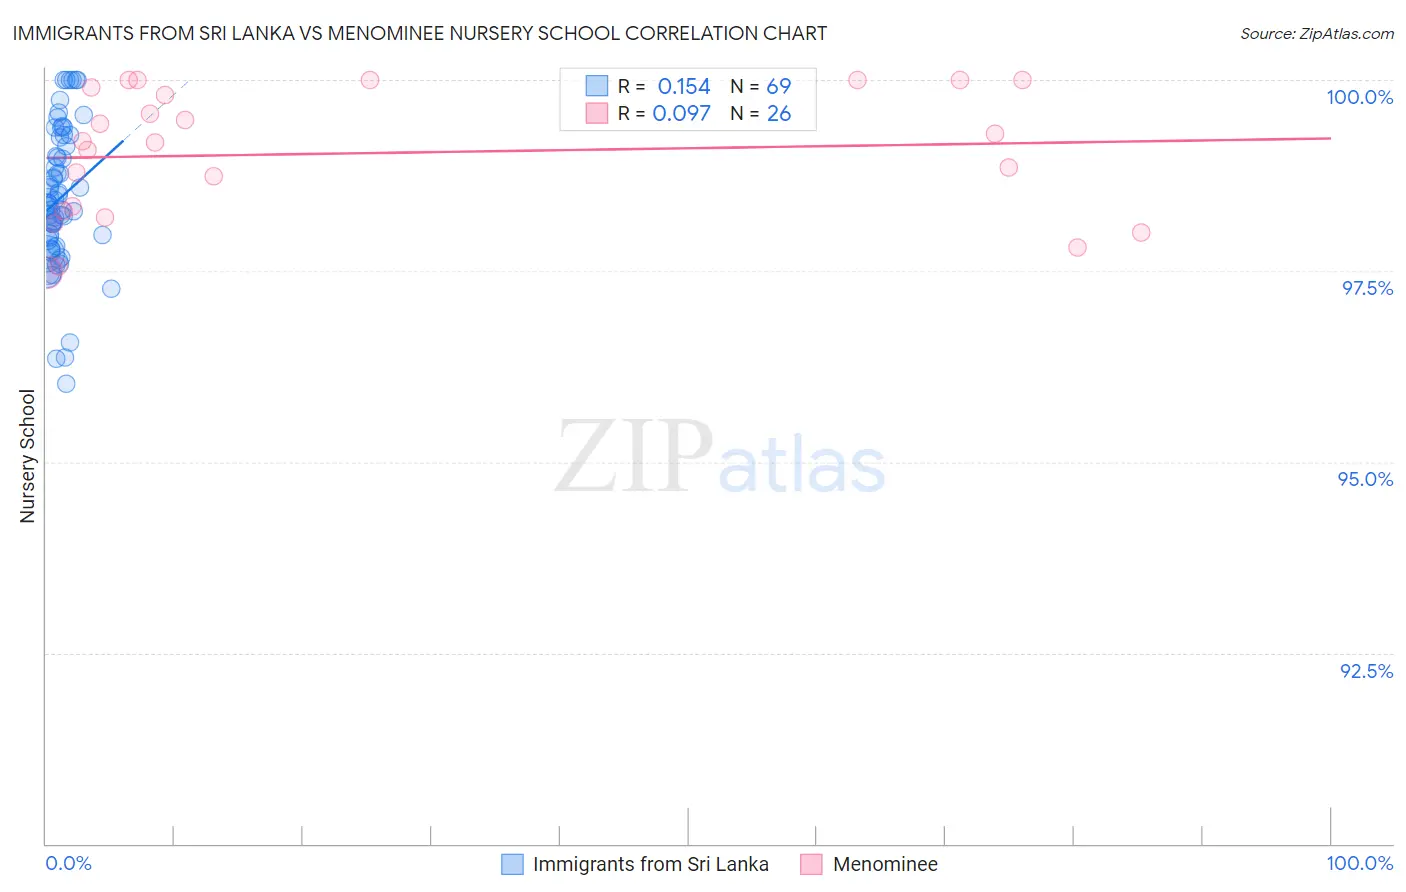
Immigrants from Sri Lanka vs Menominee Nursery School Correlation Chart
The statistical analysis conducted on geographies consisting of 149,700,552 people shows a poor positive correlation between the proportion of Immigrants from Sri Lanka and percentage of population with at least nursery school education in the United States with a correlation coefficient (R) of 0.154 and weighted average of 98.0%. Similarly, the statistical analysis conducted on geographies consisting of 45,778,979 people shows a slight positive correlation between the proportion of Menominee and percentage of population with at least nursery school education in the United States with a correlation coefficient (R) of 0.097 and weighted average of 98.2%, a difference of 0.20%.
Nursery School Correlation Summary
| Measurement | Immigrants from Sri Lanka | Menominee |
| Minimum | 96.0% | 97.5% |
| Maximum | 100.0% | 100.0% |
| Range | 4.0% | 2.5% |
| Mean | 98.4% | 99.0% |
| Median | 98.4% | 99.2% |
| Interquartile 25% (IQ1) | 97.9% | 98.3% |
| Interquartile 75% (IQ3) | 99.2% | 99.9% |
| Interquartile Range (IQR) | 1.3% | 1.6% |
| Standard Deviation (Sample) | 0.91% | 0.84% |
| Standard Deviation (Population) | 0.90% | 0.82% |
Similar Demographics by Nursery School
Demographics Similar to Immigrants from Sri Lanka by Nursery School
In terms of nursery school, the demographic groups most similar to Immigrants from Sri Lanka are Immigrants from Brazil (98.0%, a difference of 0.0%), Kenyan (98.0%, a difference of 0.0%), Navajo (98.0%, a difference of 0.0%), Immigrants from Venezuela (98.0%, a difference of 0.0%), and Albanian (98.0%, a difference of 0.0%).
| Demographics | Rating | Rank | Nursery School |
| Immigrants | Micronesia | 55.0 /100 | #168 | Average 98.0% |
| Immigrants | Korea | 53.8 /100 | #169 | Average 98.0% |
| Bermudans | 53.7 /100 | #170 | Average 98.0% |
| Immigrants | Jordan | 53.4 /100 | #171 | Average 98.0% |
| Immigrants | Brazil | 51.3 /100 | #172 | Average 98.0% |
| Kenyans | 50.2 /100 | #173 | Average 98.0% |
| Navajo | 50.0 /100 | #174 | Average 98.0% |
| Immigrants | Sri Lanka | 49.9 /100 | #175 | Average 98.0% |
| Immigrants | Venezuela | 49.8 /100 | #176 | Average 98.0% |
| Albanians | 48.9 /100 | #177 | Average 98.0% |
| Natives/Alaskans | 48.6 /100 | #178 | Average 98.0% |
| Argentineans | 46.8 /100 | #179 | Average 98.0% |
| Immigrants | Bosnia and Herzegovina | 45.6 /100 | #180 | Average 98.0% |
| Egyptians | 42.8 /100 | #181 | Average 98.0% |
| Paiute | 42.0 /100 | #182 | Average 98.0% |
Demographics Similar to Menominee by Nursery School
In terms of nursery school, the demographic groups most similar to Menominee are Syrian (98.2%, a difference of 0.0%), Lebanese (98.2%, a difference of 0.0%), Iroquois (98.2%, a difference of 0.0%), Immigrants from Saudi Arabia (98.2%, a difference of 0.0%), and Okinawan (98.2%, a difference of 0.010%).
| Demographics | Rating | Rank | Nursery School |
| Thais | 95.0 /100 | #119 | Exceptional 98.2% |
| Okinawans | 94.5 /100 | #120 | Exceptional 98.2% |
| Immigrants | Zimbabwe | 94.2 /100 | #121 | Exceptional 98.2% |
| Immigrants | Japan | 94.0 /100 | #122 | Exceptional 98.2% |
| Syrians | 93.9 /100 | #123 | Exceptional 98.2% |
| Lebanese | 93.8 /100 | #124 | Exceptional 98.2% |
| Iroquois | 93.7 /100 | #125 | Exceptional 98.2% |
| Menominee | 93.6 /100 | #126 | Exceptional 98.2% |
| Immigrants | Saudi Arabia | 93.4 /100 | #127 | Exceptional 98.2% |
| Immigrants | Serbia | 92.4 /100 | #128 | Exceptional 98.2% |
| Cambodians | 91.4 /100 | #129 | Exceptional 98.2% |
| Immigrants | Croatia | 91.4 /100 | #130 | Exceptional 98.2% |
| Spaniards | 91.1 /100 | #131 | Exceptional 98.2% |
| Seminole | 90.9 /100 | #132 | Exceptional 98.2% |
| Immigrants | Europe | 90.7 /100 | #133 | Exceptional 98.1% |