Immigrants from Sri Lanka vs Black/African American Nursery School
COMPARE
Immigrants from Sri Lanka
Black/African American
Nursery School
Nursery School Comparison
Immigrants from Sri Lanka
Blacks/African Americans
98.0%
NURSERY SCHOOL
49.9/ 100
METRIC RATING
175th/ 347
METRIC RANK
97.9%
NURSERY SCHOOL
29.4/ 100
METRIC RATING
192nd/ 347
METRIC RANK
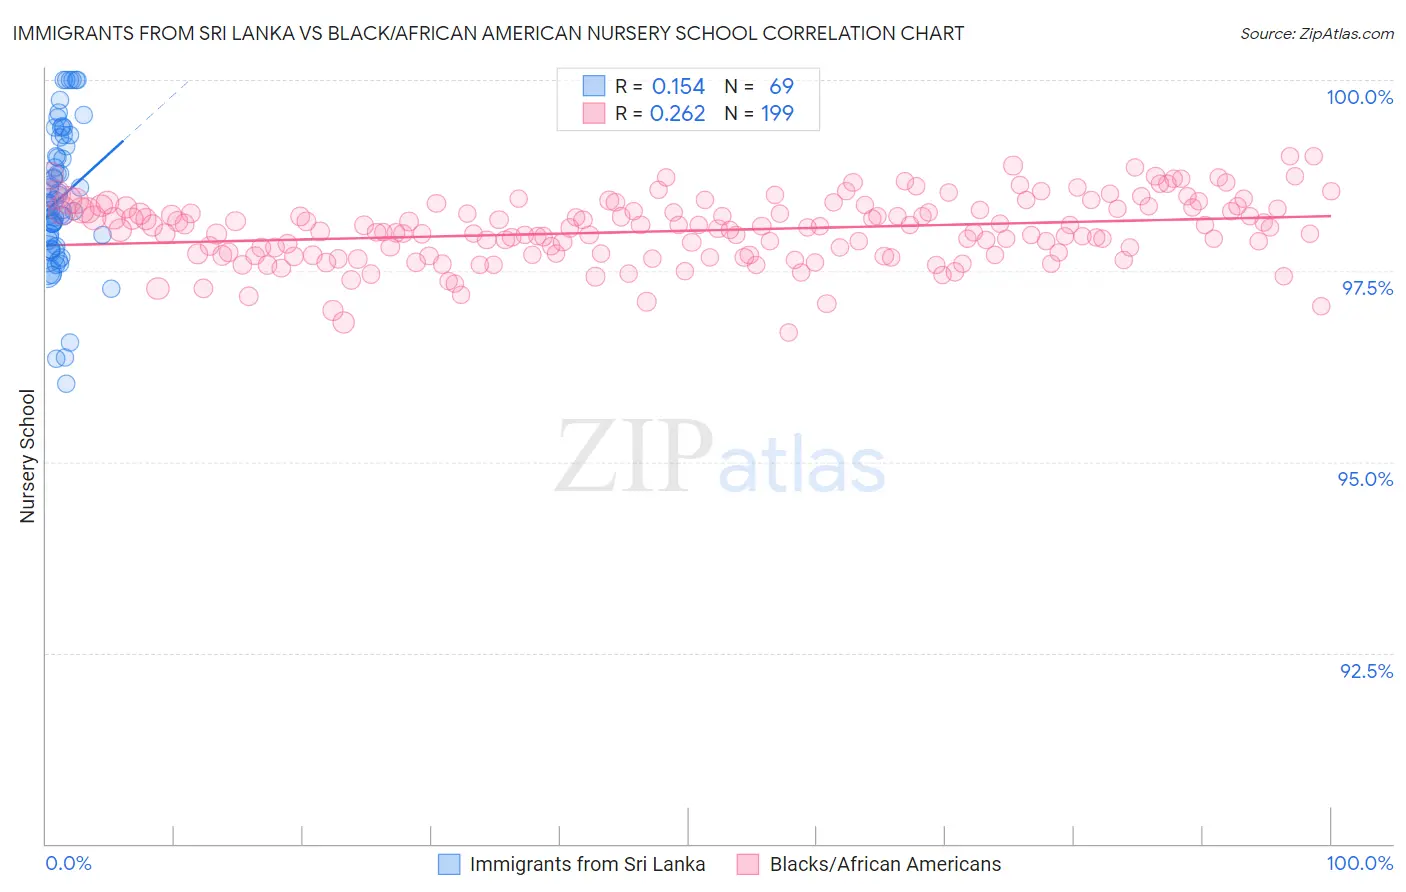
Immigrants from Sri Lanka vs Black/African American Nursery School Correlation Chart
The statistical analysis conducted on geographies consisting of 149,700,552 people shows a poor positive correlation between the proportion of Immigrants from Sri Lanka and percentage of population with at least nursery school education in the United States with a correlation coefficient (R) of 0.154 and weighted average of 98.0%. Similarly, the statistical analysis conducted on geographies consisting of 566,043,750 people shows a weak positive correlation between the proportion of Blacks/African Americans and percentage of population with at least nursery school education in the United States with a correlation coefficient (R) of 0.262 and weighted average of 97.9%, a difference of 0.070%.
Nursery School Correlation Summary
| Measurement | Immigrants from Sri Lanka | Black/African American |
| Minimum | 96.0% | 96.7% |
| Maximum | 100.0% | 99.0% |
| Range | 4.0% | 2.3% |
| Mean | 98.4% | 98.0% |
| Median | 98.4% | 98.0% |
| Interquartile 25% (IQ1) | 97.9% | 97.7% |
| Interquartile 75% (IQ3) | 99.2% | 98.3% |
| Interquartile Range (IQR) | 1.3% | 0.60% |
| Standard Deviation (Sample) | 0.91% | 0.42% |
| Standard Deviation (Population) | 0.90% | 0.42% |
Demographics Similar to Immigrants from Sri Lanka and Blacks/African Americans by Nursery School
In terms of nursery school, the demographic groups most similar to Immigrants from Sri Lanka are Kenyan (98.0%, a difference of 0.0%), Navajo (98.0%, a difference of 0.0%), Immigrants from Venezuela (98.0%, a difference of 0.0%), Albanian (98.0%, a difference of 0.0%), and Native/Alaskan (98.0%, a difference of 0.0%). Similarly, the demographic groups most similar to Blacks/African Americans are Immigrants from Taiwan (97.9%, a difference of 0.0%), Paraguayan (97.9%, a difference of 0.010%), Arab (97.9%, a difference of 0.020%), Pakistani (97.9%, a difference of 0.020%), and Panamanian (97.9%, a difference of 0.020%).
| Demographics | Rating | Rank | Nursery School |
| Kenyans | 50.2 /100 | #173 | Average 98.0% |
| Navajo | 50.0 /100 | #174 | Average 98.0% |
| Immigrants | Sri Lanka | 49.9 /100 | #175 | Average 98.0% |
| Immigrants | Venezuela | 49.8 /100 | #176 | Average 98.0% |
| Albanians | 48.9 /100 | #177 | Average 98.0% |
| Natives/Alaskans | 48.6 /100 | #178 | Average 98.0% |
| Argentineans | 46.8 /100 | #179 | Average 98.0% |
| Immigrants | Bosnia and Herzegovina | 45.6 /100 | #180 | Average 98.0% |
| Egyptians | 42.8 /100 | #181 | Average 98.0% |
| Paiute | 42.0 /100 | #182 | Average 98.0% |
| Portuguese | 41.8 /100 | #183 | Average 98.0% |
| Immigrants | Poland | 41.3 /100 | #184 | Average 98.0% |
| Immigrants | Belarus | 41.0 /100 | #185 | Average 98.0% |
| Immigrants | Argentina | 40.8 /100 | #186 | Average 98.0% |
| Immigrants | Kazakhstan | 37.1 /100 | #187 | Fair 97.9% |
| Arabs | 34.7 /100 | #188 | Fair 97.9% |
| Pakistanis | 34.6 /100 | #189 | Fair 97.9% |
| Panamanians | 34.3 /100 | #190 | Fair 97.9% |
| Immigrants | Taiwan | 30.6 /100 | #191 | Fair 97.9% |
| Blacks/African Americans | 29.4 /100 | #192 | Fair 97.9% |
| Paraguayans | 27.4 /100 | #193 | Fair 97.9% |