Immigrants from Spain vs Immigrants from Kazakhstan No Schooling Completed
COMPARE
Immigrants from Spain
Immigrants from Kazakhstan
No Schooling Completed
No Schooling Completed Comparison
Immigrants from Spain
Immigrants from Kazakhstan
2.0%
NO SCHOOLING COMPLETED
66.4/ 100
METRIC RATING
159th/ 347
METRIC RANK
2.1%
NO SCHOOLING COMPLETED
44.3/ 100
METRIC RATING
179th/ 347
METRIC RANK
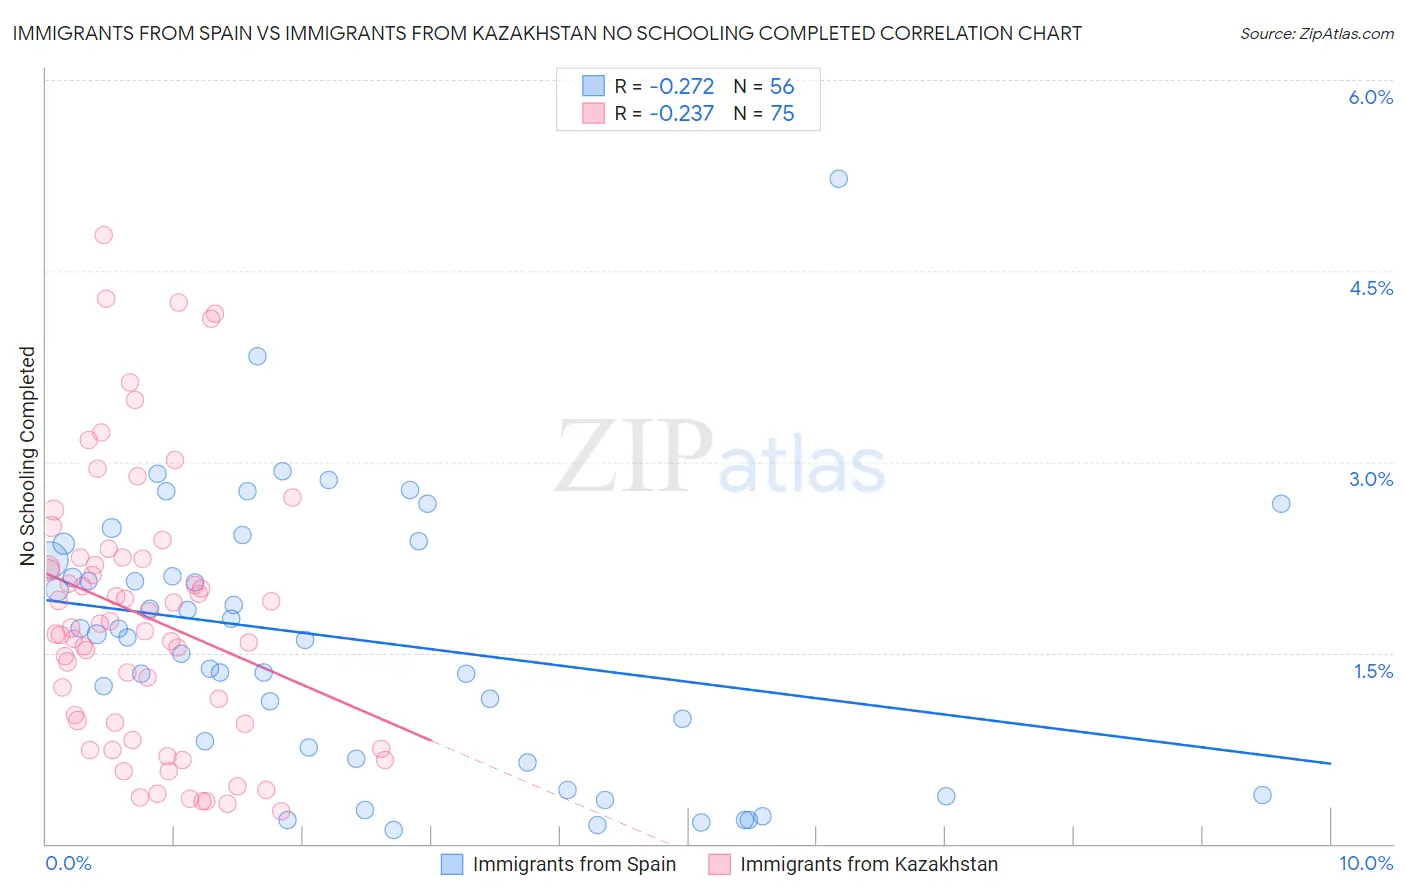
Immigrants from Spain vs Immigrants from Kazakhstan No Schooling Completed Correlation Chart
The statistical analysis conducted on geographies consisting of 238,284,767 people shows a weak negative correlation between the proportion of Immigrants from Spain and percentage of population with no schooling in the United States with a correlation coefficient (R) of -0.272 and weighted average of 2.0%. Similarly, the statistical analysis conducted on geographies consisting of 123,956,423 people shows a weak negative correlation between the proportion of Immigrants from Kazakhstan and percentage of population with no schooling in the United States with a correlation coefficient (R) of -0.237 and weighted average of 2.1%, a difference of 3.1%.
No Schooling Completed Correlation Summary
| Measurement | Immigrants from Spain | Immigrants from Kazakhstan |
| Minimum | 0.11% | 0.26% |
| Maximum | 5.2% | 4.8% |
| Range | 5.1% | 4.5% |
| Mean | 1.6% | 1.8% |
| Median | 1.6% | 1.7% |
| Interquartile 25% (IQ1) | 0.72% | 0.95% |
| Interquartile 75% (IQ3) | 2.3% | 2.2% |
| Interquartile Range (IQR) | 1.6% | 1.3% |
| Standard Deviation (Sample) | 1.0% | 1.1% |
| Standard Deviation (Population) | 1.0% | 1.1% |
Demographics Similar to Immigrants from Spain and Immigrants from Kazakhstan by No Schooling Completed
In terms of no schooling completed, the demographic groups most similar to Immigrants from Spain are Kenyan (2.0%, a difference of 0.12%), Ugandan (2.0%, a difference of 0.29%), Immigrants from Brazil (2.1%, a difference of 0.39%), Albanian (2.1%, a difference of 0.64%), and Comanche (2.1%, a difference of 0.86%). Similarly, the demographic groups most similar to Immigrants from Kazakhstan are Pakistani (2.1%, a difference of 0.050%), Arapaho (2.1%, a difference of 0.10%), Panamanian (2.1%, a difference of 0.11%), Arab (2.1%, a difference of 0.29%), and Immigrants from Micronesia (2.1%, a difference of 0.77%).
| Demographics | Rating | Rank | No Schooling Completed |
| Immigrants | Spain | 66.4 /100 | #159 | Good 2.0% |
| Kenyans | 65.7 /100 | #160 | Good 2.0% |
| Ugandans | 64.6 /100 | #161 | Good 2.0% |
| Immigrants | Brazil | 63.8 /100 | #162 | Good 2.1% |
| Albanians | 62.2 /100 | #163 | Good 2.1% |
| Comanche | 60.7 /100 | #164 | Good 2.1% |
| Brazilians | 60.2 /100 | #165 | Good 2.1% |
| Dutch West Indians | 59.9 /100 | #166 | Average 2.1% |
| Egyptians | 59.2 /100 | #167 | Average 2.1% |
| Cheyenne | 58.6 /100 | #168 | Average 2.1% |
| Apache | 56.7 /100 | #169 | Average 2.1% |
| Argentineans | 56.0 /100 | #170 | Average 2.1% |
| Immigrants | Poland | 55.2 /100 | #171 | Average 2.1% |
| Immigrants | Argentina | 52.7 /100 | #172 | Average 2.1% |
| Immigrants | Belarus | 51.8 /100 | #173 | Average 2.1% |
| Immigrants | Micronesia | 50.0 /100 | #174 | Average 2.1% |
| Arabs | 46.4 /100 | #175 | Average 2.1% |
| Panamanians | 45.2 /100 | #176 | Average 2.1% |
| Arapaho | 45.0 /100 | #177 | Average 2.1% |
| Pakistanis | 44.7 /100 | #178 | Average 2.1% |
| Immigrants | Kazakhstan | 44.3 /100 | #179 | Average 2.1% |