Immigrants from Italy vs Immigrants from Kazakhstan No Schooling Completed
COMPARE
Immigrants from Italy
Immigrants from Kazakhstan
No Schooling Completed
No Schooling Completed Comparison
Immigrants from Italy
Immigrants from Kazakhstan
2.0%
NO SCHOOLING COMPLETED
68.9/ 100
METRIC RATING
153rd/ 347
METRIC RANK
2.1%
NO SCHOOLING COMPLETED
44.3/ 100
METRIC RATING
179th/ 347
METRIC RANK
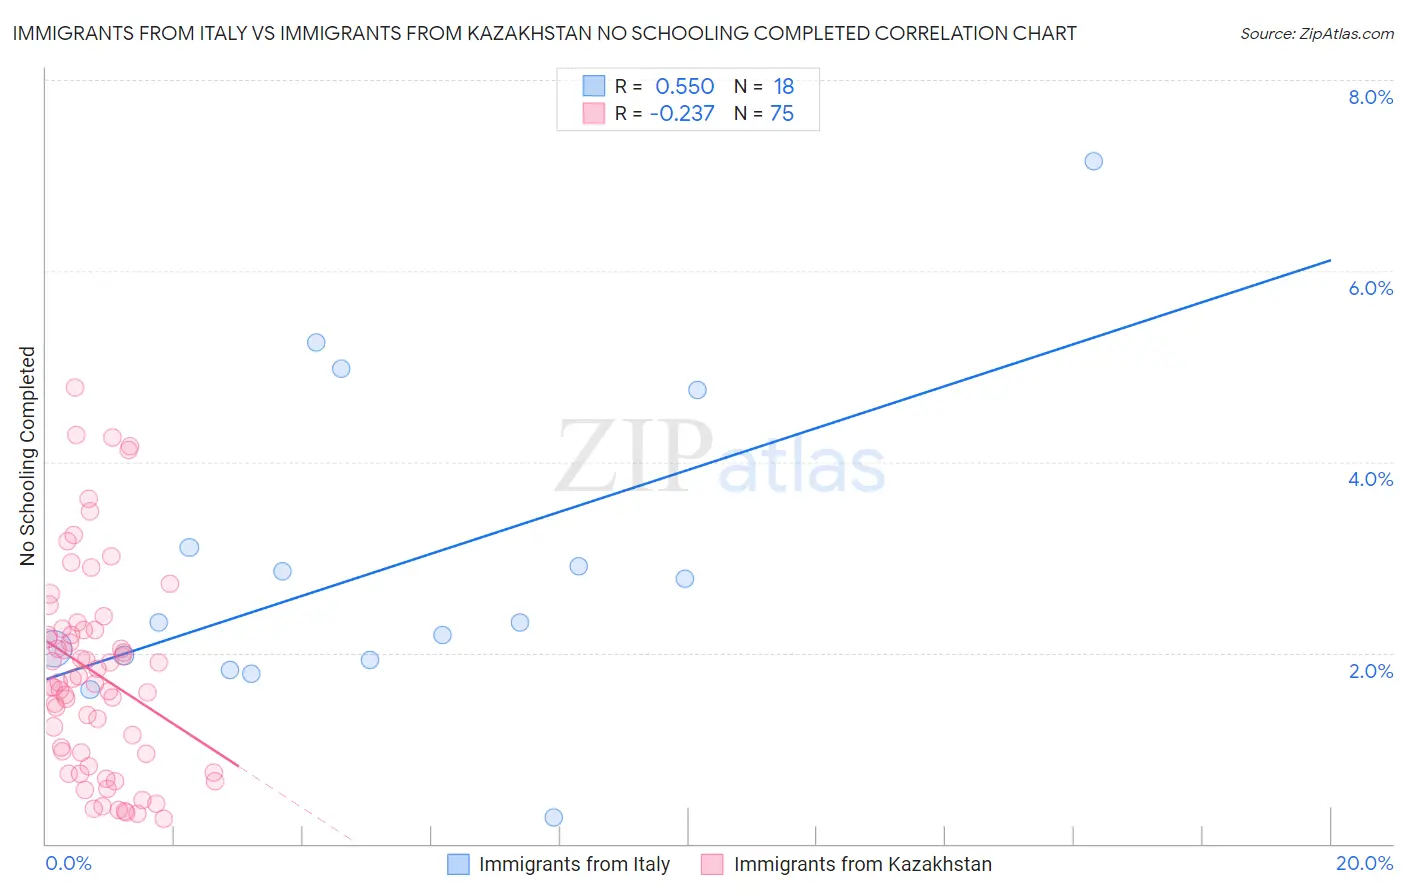
Immigrants from Italy vs Immigrants from Kazakhstan No Schooling Completed Correlation Chart
The statistical analysis conducted on geographies consisting of 321,356,663 people shows a substantial positive correlation between the proportion of Immigrants from Italy and percentage of population with no schooling in the United States with a correlation coefficient (R) of 0.550 and weighted average of 2.0%. Similarly, the statistical analysis conducted on geographies consisting of 123,956,423 people shows a weak negative correlation between the proportion of Immigrants from Kazakhstan and percentage of population with no schooling in the United States with a correlation coefficient (R) of -0.237 and weighted average of 2.1%, a difference of 3.5%.
No Schooling Completed Correlation Summary
| Measurement | Immigrants from Italy | Immigrants from Kazakhstan |
| Minimum | 0.28% | 0.26% |
| Maximum | 7.1% | 4.8% |
| Range | 6.9% | 4.5% |
| Mean | 2.9% | 1.8% |
| Median | 2.3% | 1.7% |
| Interquartile 25% (IQ1) | 1.9% | 0.95% |
| Interquartile 75% (IQ3) | 3.1% | 2.2% |
| Interquartile Range (IQR) | 1.2% | 1.3% |
| Standard Deviation (Sample) | 1.6% | 1.1% |
| Standard Deviation (Population) | 1.6% | 1.1% |
Similar Demographics by No Schooling Completed
Demographics Similar to Immigrants from Italy by No Schooling Completed
In terms of no schooling completed, the demographic groups most similar to Immigrants from Italy are Immigrants from Venezuela (2.0%, a difference of 0.060%), Immigrants from Russia (2.0%, a difference of 0.20%), Immigrants from Eastern Europe (2.0%, a difference of 0.24%), Chilean (2.0%, a difference of 0.27%), and Immigrants from Sri Lanka (2.0%, a difference of 0.30%).
| Demographics | Rating | Rank | No Schooling Completed |
| Immigrants | Moldova | 78.0 /100 | #146 | Good 2.0% |
| Soviet Union | 77.1 /100 | #147 | Good 2.0% |
| Shoshone | 76.7 /100 | #148 | Good 2.0% |
| Immigrants | North Macedonia | 75.9 /100 | #149 | Good 2.0% |
| Blackfeet | 72.9 /100 | #150 | Good 2.0% |
| Immigrants | Jordan | 70.9 /100 | #151 | Good 2.0% |
| Immigrants | Eastern Europe | 70.4 /100 | #152 | Good 2.0% |
| Immigrants | Italy | 68.9 /100 | #153 | Good 2.0% |
| Immigrants | Venezuela | 68.5 /100 | #154 | Good 2.0% |
| Immigrants | Russia | 67.6 /100 | #155 | Good 2.0% |
| Chileans | 67.2 /100 | #156 | Good 2.0% |
| Immigrants | Sri Lanka | 67.0 /100 | #157 | Good 2.0% |
| Immigrants | Korea | 66.7 /100 | #158 | Good 2.0% |
| Immigrants | Spain | 66.4 /100 | #159 | Good 2.0% |
| Kenyans | 65.7 /100 | #160 | Good 2.0% |
Demographics Similar to Immigrants from Kazakhstan by No Schooling Completed
In terms of no schooling completed, the demographic groups most similar to Immigrants from Kazakhstan are Pakistani (2.1%, a difference of 0.050%), Portuguese (2.1%, a difference of 0.060%), Arapaho (2.1%, a difference of 0.10%), Panamanian (2.1%, a difference of 0.11%), and Immigrants from Taiwan (2.1%, a difference of 0.24%).
| Demographics | Rating | Rank | No Schooling Completed |
| Immigrants | Argentina | 52.7 /100 | #172 | Average 2.1% |
| Immigrants | Belarus | 51.8 /100 | #173 | Average 2.1% |
| Immigrants | Micronesia | 50.0 /100 | #174 | Average 2.1% |
| Arabs | 46.4 /100 | #175 | Average 2.1% |
| Panamanians | 45.2 /100 | #176 | Average 2.1% |
| Arapaho | 45.0 /100 | #177 | Average 2.1% |
| Pakistanis | 44.7 /100 | #178 | Average 2.1% |
| Immigrants | Kazakhstan | 44.3 /100 | #179 | Average 2.1% |
| Portuguese | 43.9 /100 | #180 | Average 2.1% |
| Immigrants | Taiwan | 42.6 /100 | #181 | Average 2.1% |
| French American Indians | 42.2 /100 | #182 | Average 2.1% |
| Blacks/African Americans | 41.4 /100 | #183 | Average 2.1% |
| Pima | 41.3 /100 | #184 | Average 2.1% |
| Mongolians | 40.8 /100 | #185 | Average 2.1% |
| Immigrants | Bosnia and Herzegovina | 38.6 /100 | #186 | Fair 2.1% |