Immigrants from South America vs Pennsylvania German 11th Grade
COMPARE
Immigrants from South America
Pennsylvania German
11th Grade
11th Grade Comparison
Immigrants from South America
Pennsylvania Germans
91.4%
11TH GRADE
0.8/ 100
METRIC RATING
253rd/ 347
METRIC RANK
90.3%
11TH GRADE
0.0/ 100
METRIC RATING
288th/ 347
METRIC RANK
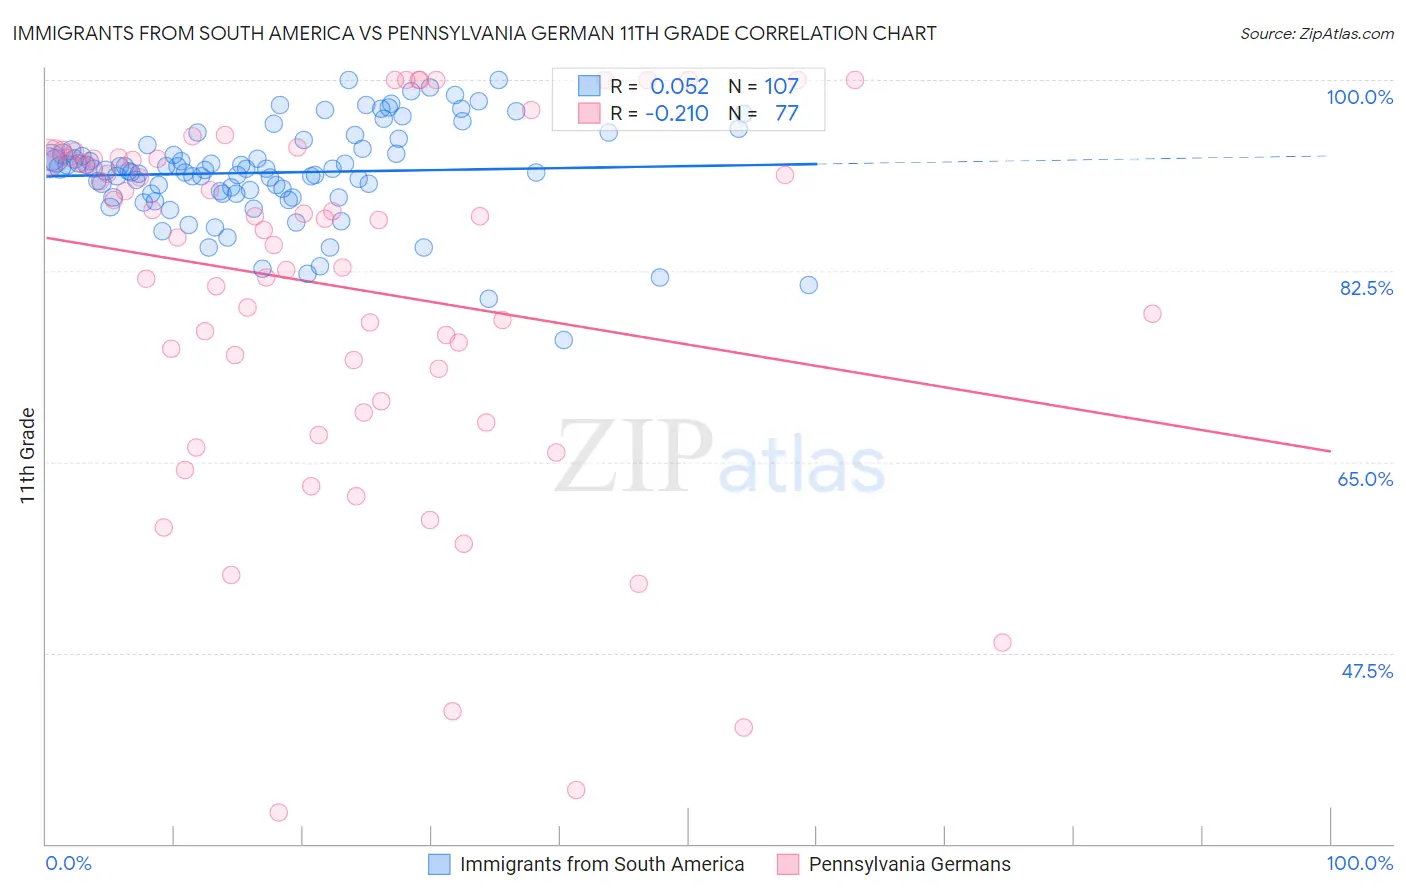
Immigrants from South America vs Pennsylvania German 11th Grade Correlation Chart
The statistical analysis conducted on geographies consisting of 486,312,594 people shows a slight positive correlation between the proportion of Immigrants from South America and percentage of population with at least 11th grade education in the United States with a correlation coefficient (R) of 0.052 and weighted average of 91.4%. Similarly, the statistical analysis conducted on geographies consisting of 234,103,013 people shows a weak negative correlation between the proportion of Pennsylvania Germans and percentage of population with at least 11th grade education in the United States with a correlation coefficient (R) of -0.210 and weighted average of 90.3%, a difference of 1.2%.
11th Grade Correlation Summary
| Measurement | Immigrants from South America | Pennsylvania German |
| Minimum | 76.1% | 32.9% |
| Maximum | 100.0% | 100.0% |
| Range | 23.9% | 67.1% |
| Mean | 91.5% | 81.0% |
| Median | 91.8% | 87.1% |
| Interquartile 25% (IQ1) | 89.6% | 72.1% |
| Interquartile 75% (IQ3) | 93.7% | 92.9% |
| Interquartile Range (IQR) | 4.1% | 20.8% |
| Standard Deviation (Sample) | 4.4% | 16.6% |
| Standard Deviation (Population) | 4.4% | 16.4% |
Similar Demographics by 11th Grade
Demographics Similar to Immigrants from South America by 11th Grade
In terms of 11th grade, the demographic groups most similar to Immigrants from South America are Immigrants from Nigeria (91.4%, a difference of 0.010%), Immigrants from Costa Rica (91.4%, a difference of 0.020%), Immigrants from Eritrea (91.4%, a difference of 0.020%), Black/African American (91.4%, a difference of 0.020%), and Immigrants from Senegal (91.4%, a difference of 0.030%).
| Demographics | Rating | Rank | 11th Grade |
| Seminole | 1.2 /100 | #246 | Tragic 91.5% |
| Immigrants | Philippines | 1.0 /100 | #247 | Tragic 91.5% |
| Immigrants | Uzbekistan | 1.0 /100 | #248 | Tragic 91.5% |
| Peruvians | 1.0 /100 | #249 | Tragic 91.5% |
| Ghanaians | 0.9 /100 | #250 | Tragic 91.5% |
| Immigrants | Costa Rica | 0.9 /100 | #251 | Tragic 91.4% |
| Immigrants | Nigeria | 0.8 /100 | #252 | Tragic 91.4% |
| Immigrants | South America | 0.8 /100 | #253 | Tragic 91.4% |
| Immigrants | Eritrea | 0.7 /100 | #254 | Tragic 91.4% |
| Blacks/African Americans | 0.7 /100 | #255 | Tragic 91.4% |
| Immigrants | Senegal | 0.7 /100 | #256 | Tragic 91.4% |
| Cajuns | 0.7 /100 | #257 | Tragic 91.4% |
| Immigrants | Colombia | 0.6 /100 | #258 | Tragic 91.4% |
| Jamaicans | 0.6 /100 | #259 | Tragic 91.4% |
| Spanish Americans | 0.6 /100 | #260 | Tragic 91.4% |
Demographics Similar to Pennsylvania Germans by 11th Grade
In terms of 11th grade, the demographic groups most similar to Pennsylvania Germans are Apache (90.4%, a difference of 0.020%), British West Indian (90.3%, a difference of 0.020%), Immigrants from West Indies (90.4%, a difference of 0.030%), Indonesian (90.3%, a difference of 0.050%), and Immigrants from Burma/Myanmar (90.4%, a difference of 0.080%).
| Demographics | Rating | Rank | 11th Grade |
| Dutch West Indians | 0.0 /100 | #281 | Tragic 90.7% |
| Immigrants | St. Vincent and the Grenadines | 0.0 /100 | #282 | Tragic 90.7% |
| Immigrants | Barbados | 0.0 /100 | #283 | Tragic 90.7% |
| Immigrants | Laos | 0.0 /100 | #284 | Tragic 90.5% |
| Immigrants | Burma/Myanmar | 0.0 /100 | #285 | Tragic 90.4% |
| Immigrants | West Indies | 0.0 /100 | #286 | Tragic 90.4% |
| Apache | 0.0 /100 | #287 | Tragic 90.4% |
| Pennsylvania Germans | 0.0 /100 | #288 | Tragic 90.3% |
| British West Indians | 0.0 /100 | #289 | Tragic 90.3% |
| Indonesians | 0.0 /100 | #290 | Tragic 90.3% |
| Haitians | 0.0 /100 | #291 | Tragic 90.3% |
| Cubans | 0.0 /100 | #292 | Tragic 90.2% |
| Natives/Alaskans | 0.0 /100 | #293 | Tragic 90.2% |
| Immigrants | Grenada | 0.0 /100 | #294 | Tragic 90.1% |
| Immigrants | Vietnam | 0.0 /100 | #295 | Tragic 90.0% |