Carpatho Rusyn vs Pennsylvania German 11th Grade
COMPARE
Carpatho Rusyn
Pennsylvania German
11th Grade
11th Grade Comparison
Carpatho Rusyns
Pennsylvania Germans
94.8%
11TH GRADE
100.0/ 100
METRIC RATING
5th/ 347
METRIC RANK
90.3%
11TH GRADE
0.0/ 100
METRIC RATING
288th/ 347
METRIC RANK
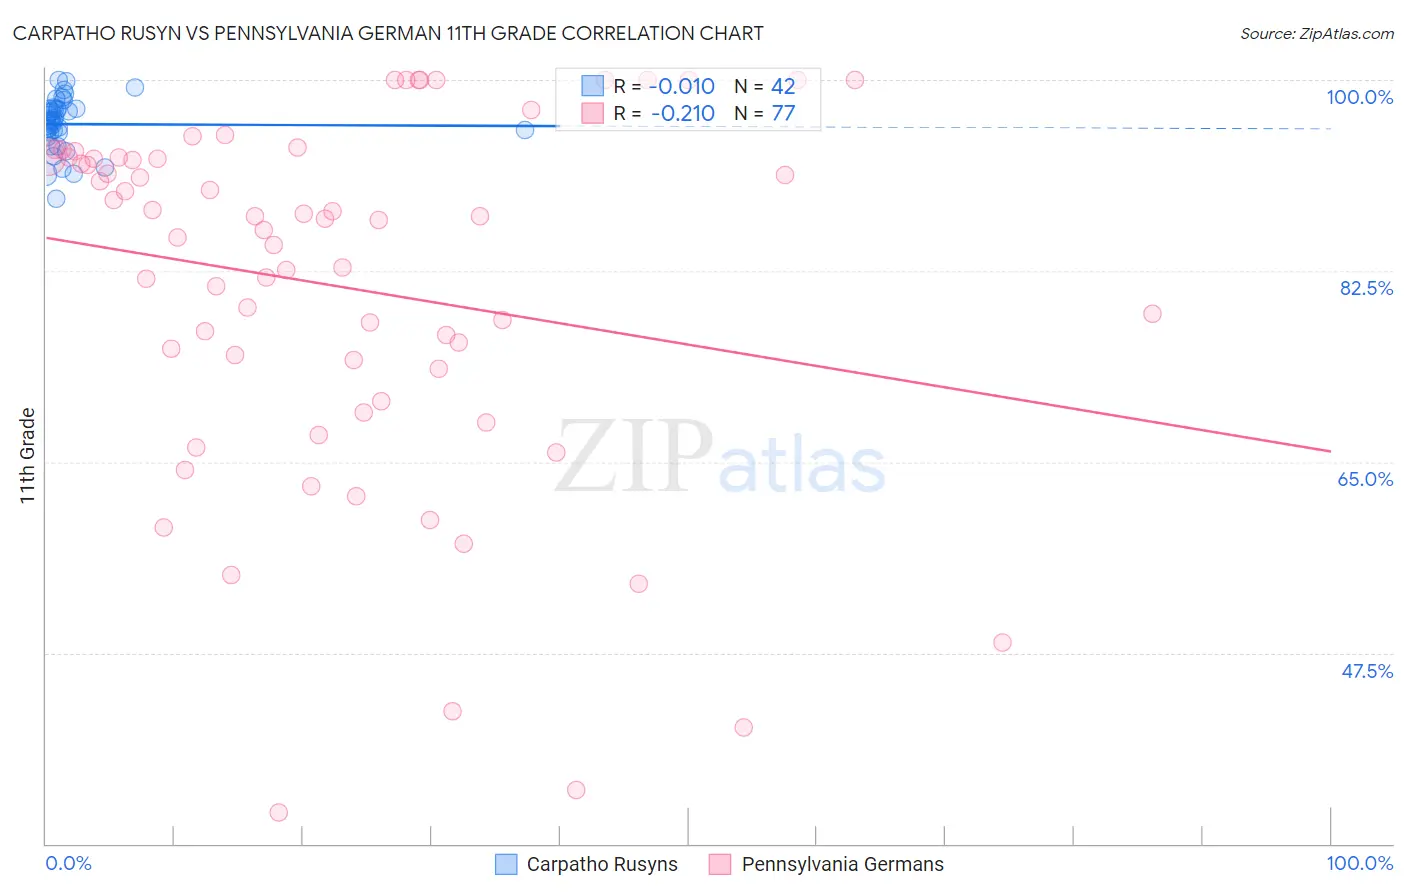
Carpatho Rusyn vs Pennsylvania German 11th Grade Correlation Chart
The statistical analysis conducted on geographies consisting of 58,871,690 people shows no correlation between the proportion of Carpatho Rusyns and percentage of population with at least 11th grade education in the United States with a correlation coefficient (R) of -0.010 and weighted average of 94.8%. Similarly, the statistical analysis conducted on geographies consisting of 234,103,013 people shows a weak negative correlation between the proportion of Pennsylvania Germans and percentage of population with at least 11th grade education in the United States with a correlation coefficient (R) of -0.210 and weighted average of 90.3%, a difference of 5.0%.
11th Grade Correlation Summary
| Measurement | Carpatho Rusyn | Pennsylvania German |
| Minimum | 89.1% | 32.9% |
| Maximum | 100.0% | 100.0% |
| Range | 10.9% | 67.1% |
| Mean | 95.9% | 81.0% |
| Median | 96.3% | 87.1% |
| Interquartile 25% (IQ1) | 95.2% | 72.1% |
| Interquartile 75% (IQ3) | 97.4% | 92.9% |
| Interquartile Range (IQR) | 2.1% | 20.8% |
| Standard Deviation (Sample) | 2.4% | 16.6% |
| Standard Deviation (Population) | 2.4% | 16.4% |
Similar Demographics by 11th Grade
Demographics Similar to Carpatho Rusyns by 11th Grade
In terms of 11th grade, the demographic groups most similar to Carpatho Rusyns are Lithuanian (94.8%, a difference of 0.050%), Slovak (94.9%, a difference of 0.060%), Slovene (94.9%, a difference of 0.080%), Swedish (94.9%, a difference of 0.10%), and Polish (94.8%, a difference of 0.10%).
| Demographics | Rating | Rank | 11th Grade |
| Norwegians | 100.0 /100 | #1 | Exceptional 95.2% |
| Swedes | 100.0 /100 | #2 | Exceptional 94.9% |
| Slovenes | 100.0 /100 | #3 | Exceptional 94.9% |
| Slovaks | 100.0 /100 | #4 | Exceptional 94.9% |
| Carpatho Rusyns | 100.0 /100 | #5 | Exceptional 94.8% |
| Lithuanians | 100.0 /100 | #6 | Exceptional 94.8% |
| Poles | 100.0 /100 | #7 | Exceptional 94.8% |
| Croatians | 100.0 /100 | #8 | Exceptional 94.7% |
| Danes | 100.0 /100 | #9 | Exceptional 94.7% |
| Finns | 100.0 /100 | #10 | Exceptional 94.7% |
| Germans | 100.0 /100 | #11 | Exceptional 94.7% |
| Latvians | 100.0 /100 | #12 | Exceptional 94.7% |
| Chinese | 100.0 /100 | #13 | Exceptional 94.6% |
| Eastern Europeans | 100.0 /100 | #14 | Exceptional 94.6% |
| Bulgarians | 100.0 /100 | #15 | Exceptional 94.5% |
Demographics Similar to Pennsylvania Germans by 11th Grade
In terms of 11th grade, the demographic groups most similar to Pennsylvania Germans are Apache (90.4%, a difference of 0.020%), British West Indian (90.3%, a difference of 0.020%), Immigrants from West Indies (90.4%, a difference of 0.030%), Indonesian (90.3%, a difference of 0.050%), and Immigrants from Burma/Myanmar (90.4%, a difference of 0.080%).
| Demographics | Rating | Rank | 11th Grade |
| Dutch West Indians | 0.0 /100 | #281 | Tragic 90.7% |
| Immigrants | St. Vincent and the Grenadines | 0.0 /100 | #282 | Tragic 90.7% |
| Immigrants | Barbados | 0.0 /100 | #283 | Tragic 90.7% |
| Immigrants | Laos | 0.0 /100 | #284 | Tragic 90.5% |
| Immigrants | Burma/Myanmar | 0.0 /100 | #285 | Tragic 90.4% |
| Immigrants | West Indies | 0.0 /100 | #286 | Tragic 90.4% |
| Apache | 0.0 /100 | #287 | Tragic 90.4% |
| Pennsylvania Germans | 0.0 /100 | #288 | Tragic 90.3% |
| British West Indians | 0.0 /100 | #289 | Tragic 90.3% |
| Indonesians | 0.0 /100 | #290 | Tragic 90.3% |
| Haitians | 0.0 /100 | #291 | Tragic 90.3% |
| Cubans | 0.0 /100 | #292 | Tragic 90.2% |
| Natives/Alaskans | 0.0 /100 | #293 | Tragic 90.2% |
| Immigrants | Grenada | 0.0 /100 | #294 | Tragic 90.1% |
| Immigrants | Vietnam | 0.0 /100 | #295 | Tragic 90.0% |