Immigrants from South America vs Alaskan Athabascan Nursery School
COMPARE
Immigrants from South America
Alaskan Athabascan
Nursery School
Nursery School Comparison
Immigrants from South America
Alaskan Athabascans
97.6%
NURSERY SCHOOL
0.4/ 100
METRIC RATING
260th/ 347
METRIC RANK
98.8%
NURSERY SCHOOL
100.0/ 100
METRIC RATING
6th/ 347
METRIC RANK
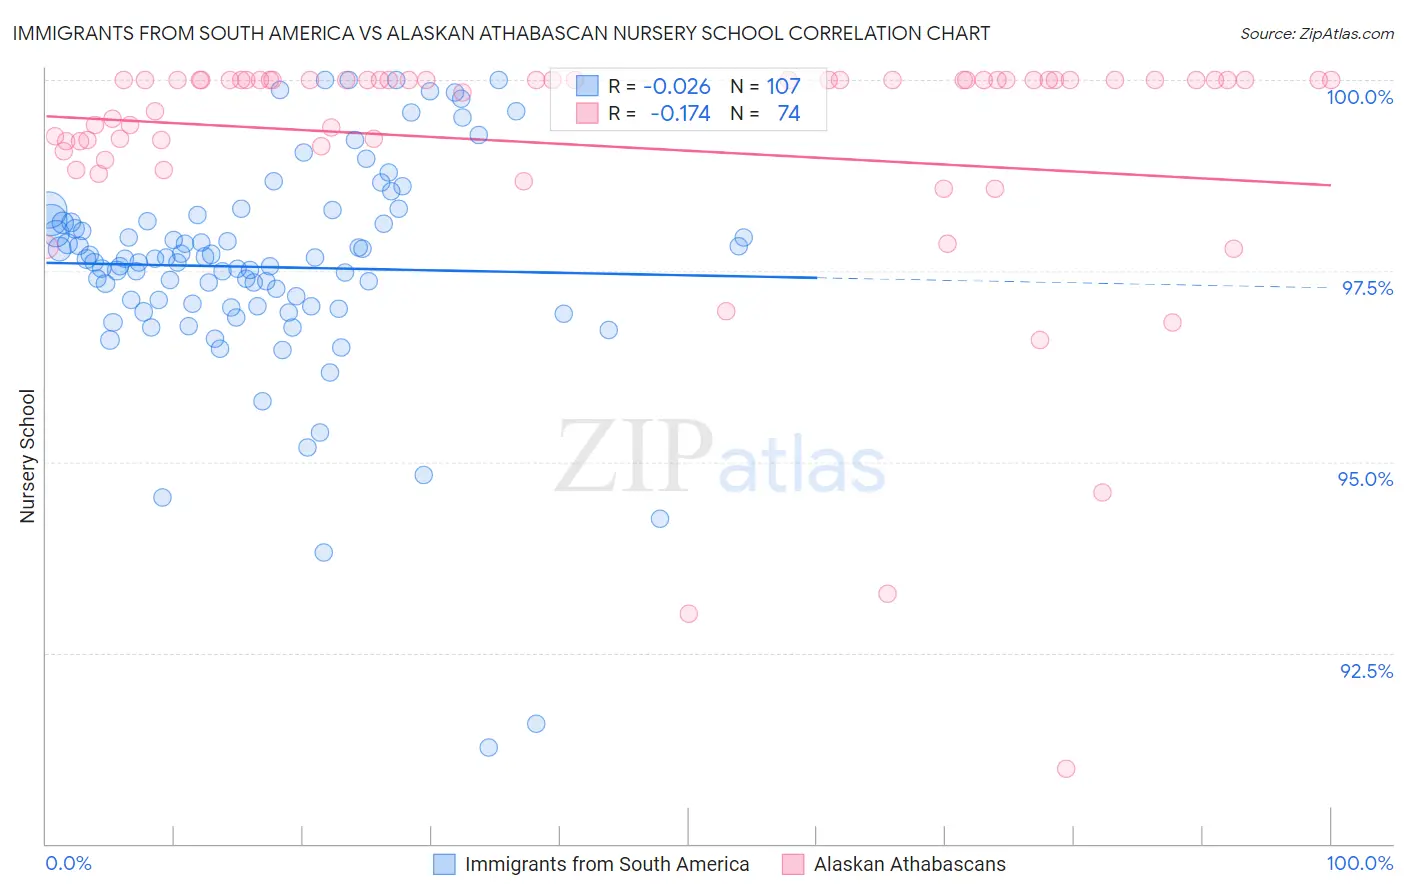
Immigrants from South America vs Alaskan Athabascan Nursery School Correlation Chart
The statistical analysis conducted on geographies consisting of 486,429,719 people shows no correlation between the proportion of Immigrants from South America and percentage of population with at least nursery school education in the United States with a correlation coefficient (R) of -0.026 and weighted average of 97.6%. Similarly, the statistical analysis conducted on geographies consisting of 45,820,365 people shows a poor negative correlation between the proportion of Alaskan Athabascans and percentage of population with at least nursery school education in the United States with a correlation coefficient (R) of -0.174 and weighted average of 98.8%, a difference of 1.3%.
Nursery School Correlation Summary
| Measurement | Immigrants from South America | Alaskan Athabascan |
| Minimum | 91.3% | 91.0% |
| Maximum | 100.0% | 100.0% |
| Range | 8.7% | 9.0% |
| Mean | 97.5% | 99.1% |
| Median | 97.7% | 100.0% |
| Interquartile 25% (IQ1) | 97.0% | 99.1% |
| Interquartile 75% (IQ3) | 98.2% | 100.0% |
| Interquartile Range (IQR) | 1.1% | 0.87% |
| Standard Deviation (Sample) | 1.5% | 1.7% |
| Standard Deviation (Population) | 1.4% | 1.7% |
Similar Demographics by Nursery School
Demographics Similar to Immigrants from South America by Nursery School
In terms of nursery school, the demographic groups most similar to Immigrants from South America are Armenian (97.6%, a difference of 0.0%), Cuban (97.6%, a difference of 0.0%), Immigrants from Ethiopia (97.6%, a difference of 0.010%), Fijian (97.6%, a difference of 0.010%), and Taiwanese (97.6%, a difference of 0.010%).
| Demographics | Rating | Rank | Nursery School |
| Immigrants | Iraq | 0.7 /100 | #253 | Tragic 97.6% |
| Immigrants | Congo | 0.7 /100 | #254 | Tragic 97.6% |
| Immigrants | Asia | 0.7 /100 | #255 | Tragic 97.6% |
| Yaqui | 0.6 /100 | #256 | Tragic 97.6% |
| Immigrants | Colombia | 0.6 /100 | #257 | Tragic 97.6% |
| Jamaicans | 0.6 /100 | #258 | Tragic 97.6% |
| Armenians | 0.4 /100 | #259 | Tragic 97.6% |
| Immigrants | South America | 0.4 /100 | #260 | Tragic 97.6% |
| Cubans | 0.4 /100 | #261 | Tragic 97.6% |
| Immigrants | Ethiopia | 0.4 /100 | #262 | Tragic 97.6% |
| Fijians | 0.3 /100 | #263 | Tragic 97.6% |
| Taiwanese | 0.3 /100 | #264 | Tragic 97.6% |
| Assyrians/Chaldeans/Syriacs | 0.3 /100 | #265 | Tragic 97.6% |
| Immigrants | Sierra Leone | 0.3 /100 | #266 | Tragic 97.6% |
| Immigrants | Nigeria | 0.3 /100 | #267 | Tragic 97.5% |
Demographics Similar to Alaskan Athabascans by Nursery School
In terms of nursery school, the demographic groups most similar to Alaskan Athabascans are Alaska Native (98.8%, a difference of 0.030%), Norwegian (98.7%, a difference of 0.060%), Tsimshian (98.9%, a difference of 0.070%), Slovak (98.7%, a difference of 0.070%), and German (98.7%, a difference of 0.070%).
| Demographics | Rating | Rank | Nursery School |
| Crow | 100.0 /100 | #1 | Exceptional 99.7% |
| Yup'ik | 100.0 /100 | #2 | Exceptional 99.2% |
| Welsh | 100.0 /100 | #3 | Exceptional 98.9% |
| Inupiat | 100.0 /100 | #4 | Exceptional 98.9% |
| Tsimshian | 100.0 /100 | #5 | Exceptional 98.9% |
| Alaskan Athabascans | 100.0 /100 | #6 | Exceptional 98.8% |
| Alaska Natives | 100.0 /100 | #7 | Exceptional 98.8% |
| Norwegians | 100.0 /100 | #8 | Exceptional 98.7% |
| Slovaks | 100.0 /100 | #9 | Exceptional 98.7% |
| Germans | 100.0 /100 | #10 | Exceptional 98.7% |
| Tlingit-Haida | 100.0 /100 | #11 | Exceptional 98.7% |
| Slovenes | 100.0 /100 | #12 | Exceptional 98.7% |
| English | 100.0 /100 | #13 | Exceptional 98.7% |
| Carpatho Rusyns | 100.0 /100 | #14 | Exceptional 98.7% |
| Swedes | 100.0 /100 | #15 | Exceptional 98.7% |