Immigrants from Senegal vs Alaskan Athabascan Nursery School
COMPARE
Immigrants from Senegal
Alaskan Athabascan
Nursery School
Nursery School Comparison
Immigrants from Senegal
Alaskan Athabascans
97.6%
NURSERY SCHOOL
0.9/ 100
METRIC RATING
250th/ 347
METRIC RANK
98.8%
NURSERY SCHOOL
100.0/ 100
METRIC RATING
6th/ 347
METRIC RANK
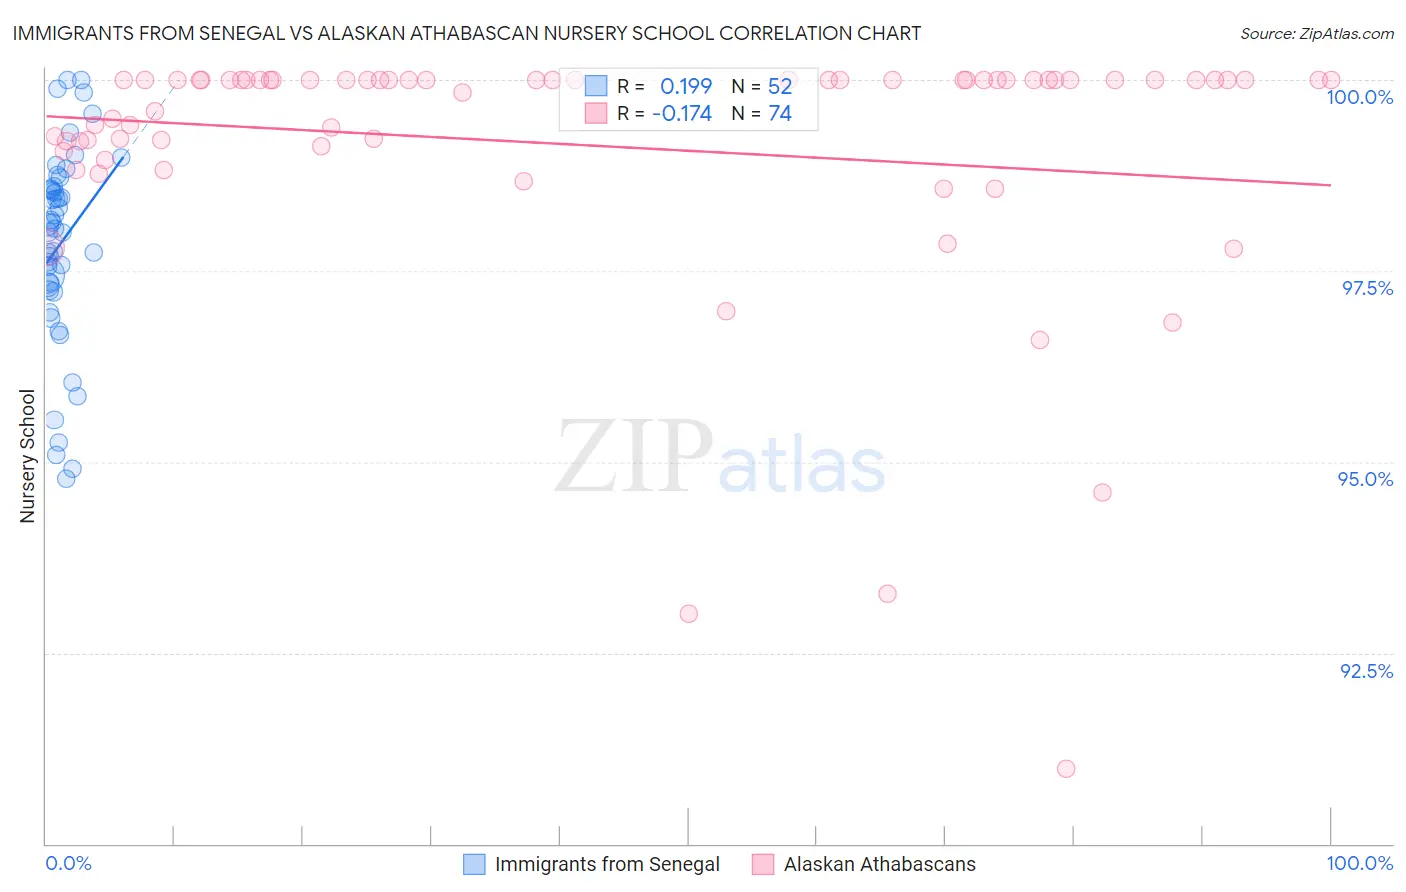
Immigrants from Senegal vs Alaskan Athabascan Nursery School Correlation Chart
The statistical analysis conducted on geographies consisting of 90,130,297 people shows a poor positive correlation between the proportion of Immigrants from Senegal and percentage of population with at least nursery school education in the United States with a correlation coefficient (R) of 0.199 and weighted average of 97.6%. Similarly, the statistical analysis conducted on geographies consisting of 45,820,365 people shows a poor negative correlation between the proportion of Alaskan Athabascans and percentage of population with at least nursery school education in the United States with a correlation coefficient (R) of -0.174 and weighted average of 98.8%, a difference of 1.2%.
Nursery School Correlation Summary
| Measurement | Immigrants from Senegal | Alaskan Athabascan |
| Minimum | 94.8% | 91.0% |
| Maximum | 100.0% | 100.0% |
| Range | 5.2% | 9.0% |
| Mean | 97.9% | 99.1% |
| Median | 98.1% | 100.0% |
| Interquartile 25% (IQ1) | 97.3% | 99.1% |
| Interquartile 75% (IQ3) | 98.6% | 100.0% |
| Interquartile Range (IQR) | 1.3% | 0.87% |
| Standard Deviation (Sample) | 1.3% | 1.7% |
| Standard Deviation (Population) | 1.3% | 1.7% |
Similar Demographics by Nursery School
Demographics Similar to Immigrants from Senegal by Nursery School
In terms of nursery school, the demographic groups most similar to Immigrants from Senegal are Immigrants from Middle Africa (97.6%, a difference of 0.0%), Indian (Asian) (97.6%, a difference of 0.0%), Immigrants from Eastern Africa (97.6%, a difference of 0.0%), Asian (97.6%, a difference of 0.010%), and South American (97.6%, a difference of 0.010%).
| Demographics | Rating | Rank | Nursery School |
| Asians | 1.1 /100 | #243 | Tragic 97.6% |
| South Americans | 1.0 /100 | #244 | Tragic 97.6% |
| Bolivians | 1.0 /100 | #245 | Tragic 97.6% |
| Peruvians | 1.0 /100 | #246 | Tragic 97.6% |
| Immigrants | Middle Africa | 0.9 /100 | #247 | Tragic 97.6% |
| Indians (Asian) | 0.9 /100 | #248 | Tragic 97.6% |
| Immigrants | Eastern Africa | 0.9 /100 | #249 | Tragic 97.6% |
| Immigrants | Senegal | 0.9 /100 | #250 | Tragic 97.6% |
| Ethiopians | 0.8 /100 | #251 | Tragic 97.6% |
| Immigrants | Africa | 0.8 /100 | #252 | Tragic 97.6% |
| Immigrants | Iraq | 0.7 /100 | #253 | Tragic 97.6% |
| Immigrants | Congo | 0.7 /100 | #254 | Tragic 97.6% |
| Immigrants | Asia | 0.7 /100 | #255 | Tragic 97.6% |
| Yaqui | 0.6 /100 | #256 | Tragic 97.6% |
| Immigrants | Colombia | 0.6 /100 | #257 | Tragic 97.6% |
Demographics Similar to Alaskan Athabascans by Nursery School
In terms of nursery school, the demographic groups most similar to Alaskan Athabascans are Alaska Native (98.8%, a difference of 0.030%), Norwegian (98.7%, a difference of 0.060%), Tsimshian (98.9%, a difference of 0.070%), Slovak (98.7%, a difference of 0.070%), and German (98.7%, a difference of 0.070%).
| Demographics | Rating | Rank | Nursery School |
| Crow | 100.0 /100 | #1 | Exceptional 99.7% |
| Yup'ik | 100.0 /100 | #2 | Exceptional 99.2% |
| Welsh | 100.0 /100 | #3 | Exceptional 98.9% |
| Inupiat | 100.0 /100 | #4 | Exceptional 98.9% |
| Tsimshian | 100.0 /100 | #5 | Exceptional 98.9% |
| Alaskan Athabascans | 100.0 /100 | #6 | Exceptional 98.8% |
| Alaska Natives | 100.0 /100 | #7 | Exceptional 98.8% |
| Norwegians | 100.0 /100 | #8 | Exceptional 98.7% |
| Slovaks | 100.0 /100 | #9 | Exceptional 98.7% |
| Germans | 100.0 /100 | #10 | Exceptional 98.7% |
| Tlingit-Haida | 100.0 /100 | #11 | Exceptional 98.7% |
| Slovenes | 100.0 /100 | #12 | Exceptional 98.7% |
| English | 100.0 /100 | #13 | Exceptional 98.7% |
| Carpatho Rusyns | 100.0 /100 | #14 | Exceptional 98.7% |
| Swedes | 100.0 /100 | #15 | Exceptional 98.7% |