Immigrants from Singapore vs Hawaiian 10th Grade
COMPARE
Immigrants from Singapore
Hawaiian
10th Grade
10th Grade Comparison
Immigrants from Singapore
Hawaiians
95.0%
10TH GRADE
99.8/ 100
METRIC RATING
63rd/ 347
METRIC RANK
93.5%
10TH GRADE
21.8/ 100
METRIC RATING
201st/ 347
METRIC RANK
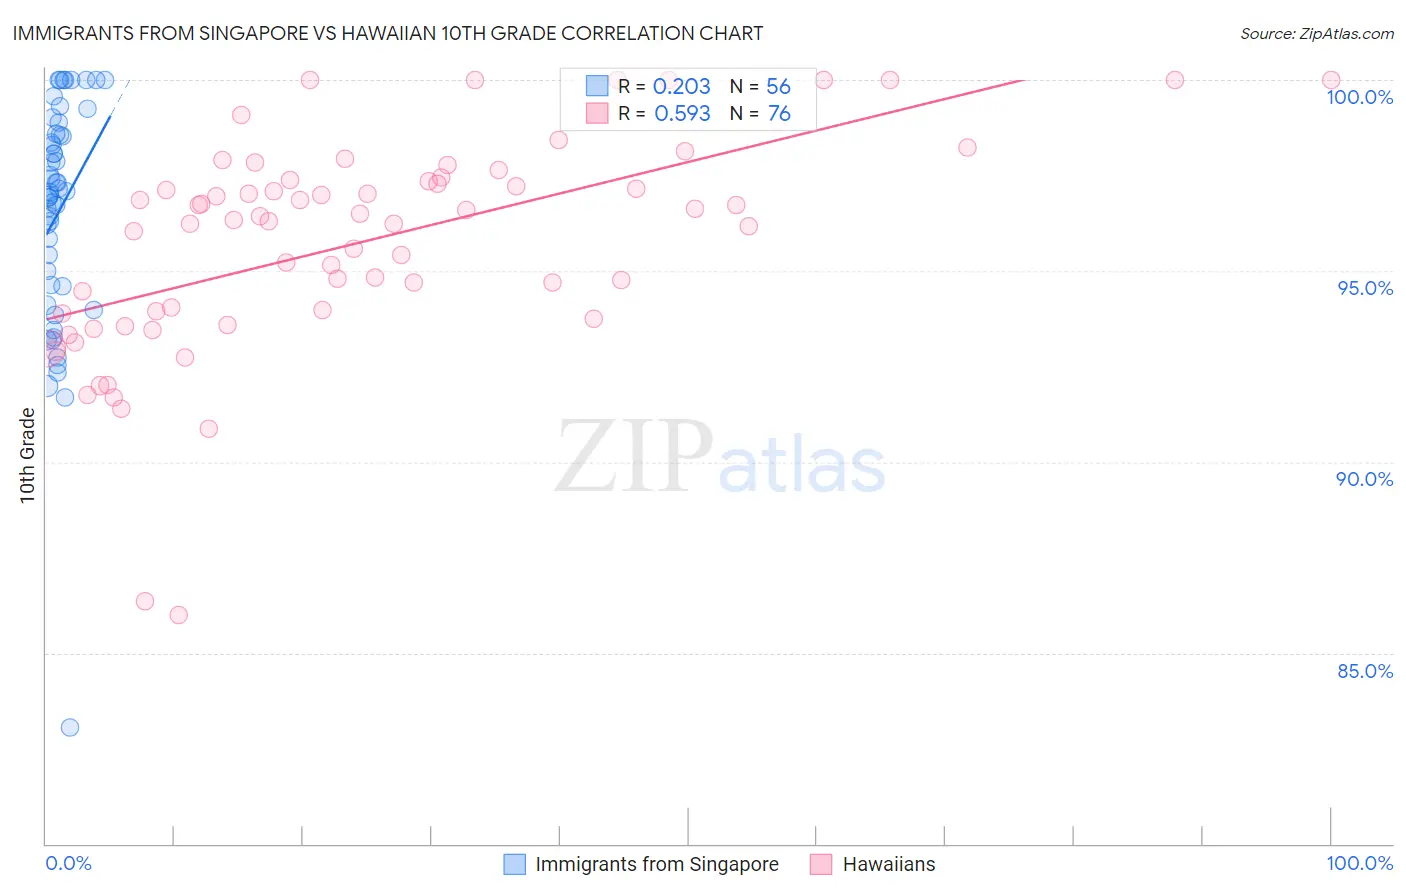
Immigrants from Singapore vs Hawaiian 10th Grade Correlation Chart
The statistical analysis conducted on geographies consisting of 137,521,094 people shows a weak positive correlation between the proportion of Immigrants from Singapore and percentage of population with at least 10th grade education in the United States with a correlation coefficient (R) of 0.203 and weighted average of 95.0%. Similarly, the statistical analysis conducted on geographies consisting of 327,620,881 people shows a substantial positive correlation between the proportion of Hawaiians and percentage of population with at least 10th grade education in the United States with a correlation coefficient (R) of 0.593 and weighted average of 93.5%, a difference of 1.6%.
10th Grade Correlation Summary
| Measurement | Immigrants from Singapore | Hawaiian |
| Minimum | 83.0% | 86.0% |
| Maximum | 100.0% | 100.0% |
| Range | 17.0% | 14.0% |
| Mean | 96.5% | 95.7% |
| Median | 97.1% | 96.4% |
| Interquartile 25% (IQ1) | 94.6% | 93.9% |
| Interquartile 75% (IQ3) | 98.6% | 97.4% |
| Interquartile Range (IQR) | 4.0% | 3.5% |
| Standard Deviation (Sample) | 3.0% | 2.8% |
| Standard Deviation (Population) | 3.0% | 2.8% |
Similar Demographics by 10th Grade
Demographics Similar to Immigrants from Singapore by 10th Grade
In terms of 10th grade, the demographic groups most similar to Immigrants from Singapore are Thai (95.0%, a difference of 0.0%), Cypriot (95.0%, a difference of 0.010%), Chippewa (95.0%, a difference of 0.010%), Native Hawaiian (95.0%, a difference of 0.010%), and Ukrainian (95.0%, a difference of 0.020%).
| Demographics | Rating | Rank | 10th Grade |
| New Zealanders | 99.8 /100 | #56 | Exceptional 95.0% |
| Ukrainians | 99.8 /100 | #57 | Exceptional 95.0% |
| Aleuts | 99.8 /100 | #58 | Exceptional 95.0% |
| Celtics | 99.8 /100 | #59 | Exceptional 95.0% |
| Cypriots | 99.8 /100 | #60 | Exceptional 95.0% |
| Chippewa | 99.8 /100 | #61 | Exceptional 95.0% |
| Thais | 99.8 /100 | #62 | Exceptional 95.0% |
| Immigrants | Singapore | 99.8 /100 | #63 | Exceptional 95.0% |
| Native Hawaiians | 99.7 /100 | #64 | Exceptional 95.0% |
| Turks | 99.7 /100 | #65 | Exceptional 95.0% |
| Immigrants | Australia | 99.7 /100 | #66 | Exceptional 94.9% |
| Immigrants | Netherlands | 99.7 /100 | #67 | Exceptional 94.9% |
| Immigrants | Belgium | 99.7 /100 | #68 | Exceptional 94.9% |
| Immigrants | England | 99.6 /100 | #69 | Exceptional 94.9% |
| Zimbabweans | 99.6 /100 | #70 | Exceptional 94.9% |
Demographics Similar to Hawaiians by 10th Grade
In terms of 10th grade, the demographic groups most similar to Hawaiians are Hopi (93.5%, a difference of 0.0%), Immigrants from Uganda (93.5%, a difference of 0.010%), Immigrants from Micronesia (93.5%, a difference of 0.020%), Asian (93.5%, a difference of 0.020%), and Immigrants from Western Asia (93.4%, a difference of 0.020%).
| Demographics | Rating | Rank | 10th Grade |
| Immigrants | Morocco | 26.9 /100 | #194 | Fair 93.5% |
| Cheyenne | 26.8 /100 | #195 | Fair 93.5% |
| Moroccans | 25.3 /100 | #196 | Fair 93.5% |
| Pueblo | 23.9 /100 | #197 | Fair 93.5% |
| Immigrants | Micronesia | 23.2 /100 | #198 | Fair 93.5% |
| Asians | 23.0 /100 | #199 | Fair 93.5% |
| Hopi | 22.2 /100 | #200 | Fair 93.5% |
| Hawaiians | 21.8 /100 | #201 | Fair 93.5% |
| Immigrants | Uganda | 20.9 /100 | #202 | Fair 93.5% |
| Immigrants | Western Asia | 20.6 /100 | #203 | Fair 93.4% |
| Ute | 20.3 /100 | #204 | Fair 93.4% |
| Immigrants | Indonesia | 20.2 /100 | #205 | Fair 93.4% |
| Immigrants | Sudan | 20.0 /100 | #206 | Fair 93.4% |
| Samoans | 19.5 /100 | #207 | Poor 93.4% |
| Immigrants | Syria | 19.4 /100 | #208 | Poor 93.4% |