Immigrants from Eastern Africa vs Hawaiian 10th Grade
COMPARE
Immigrants from Eastern Africa
Hawaiian
10th Grade
10th Grade Comparison
Immigrants from Eastern Africa
Hawaiians
93.4%
10TH GRADE
14.7/ 100
METRIC RATING
216th/ 347
METRIC RANK
93.5%
10TH GRADE
21.8/ 100
METRIC RATING
201st/ 347
METRIC RANK
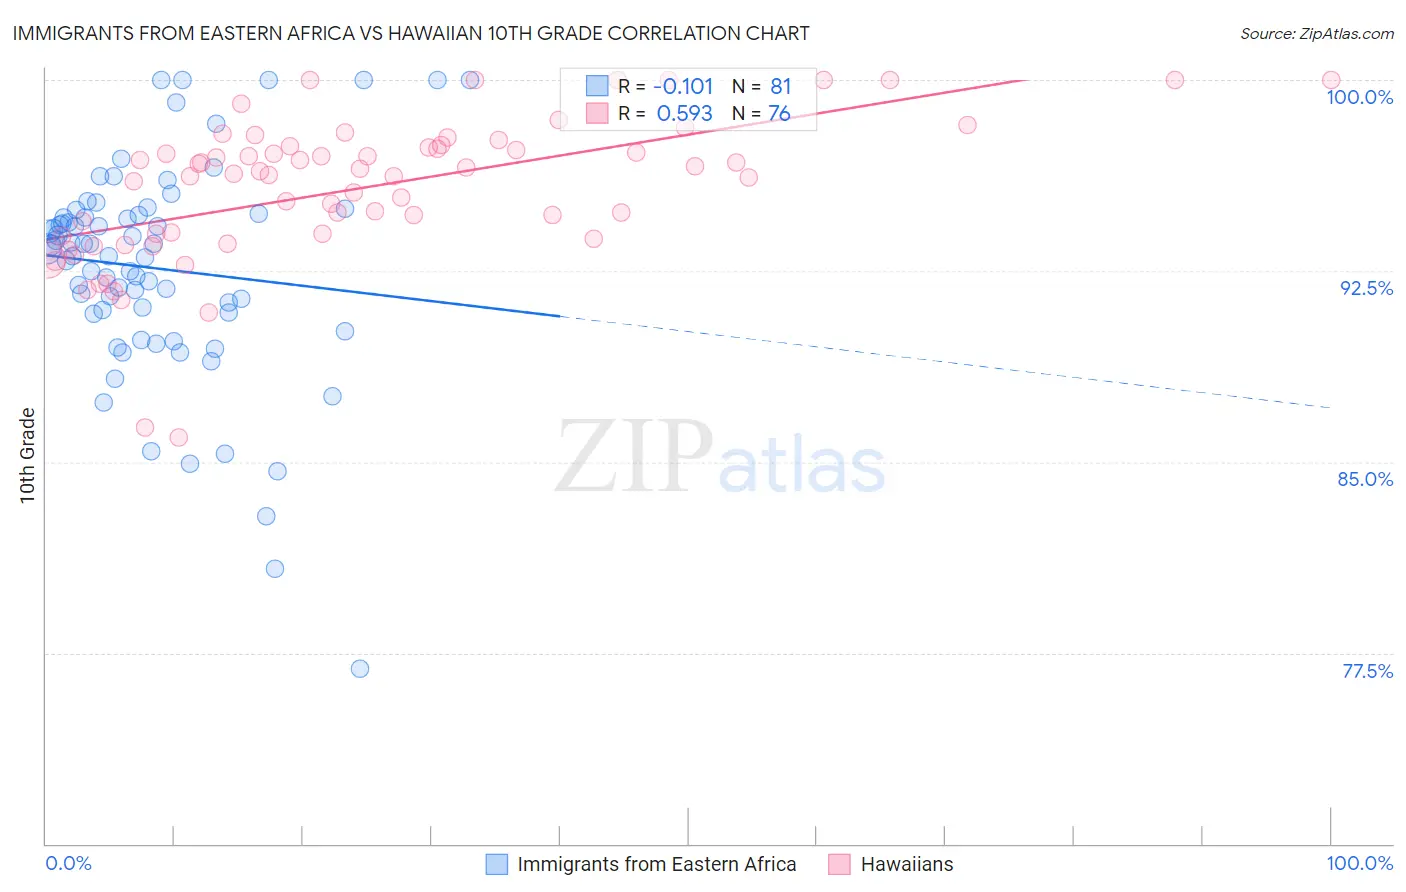
Immigrants from Eastern Africa vs Hawaiian 10th Grade Correlation Chart
The statistical analysis conducted on geographies consisting of 355,144,184 people shows a poor negative correlation between the proportion of Immigrants from Eastern Africa and percentage of population with at least 10th grade education in the United States with a correlation coefficient (R) of -0.101 and weighted average of 93.4%. Similarly, the statistical analysis conducted on geographies consisting of 327,620,881 people shows a substantial positive correlation between the proportion of Hawaiians and percentage of population with at least 10th grade education in the United States with a correlation coefficient (R) of 0.593 and weighted average of 93.5%, a difference of 0.11%.
10th Grade Correlation Summary
| Measurement | Immigrants from Eastern Africa | Hawaiian |
| Minimum | 76.9% | 86.0% |
| Maximum | 100.0% | 100.0% |
| Range | 23.1% | 14.0% |
| Mean | 92.6% | 95.7% |
| Median | 93.4% | 96.4% |
| Interquartile 25% (IQ1) | 90.8% | 93.9% |
| Interquartile 75% (IQ3) | 94.7% | 97.4% |
| Interquartile Range (IQR) | 3.9% | 3.5% |
| Standard Deviation (Sample) | 4.3% | 2.8% |
| Standard Deviation (Population) | 4.2% | 2.8% |
Demographics Similar to Immigrants from Eastern Africa and Hawaiians by 10th Grade
In terms of 10th grade, the demographic groups most similar to Immigrants from Eastern Africa are Immigrants from Bahamas (93.4%, a difference of 0.010%), Immigrants from Oceania (93.4%, a difference of 0.010%), Immigrants from Asia (93.4%, a difference of 0.020%), Immigrants from Zaire (93.4%, a difference of 0.030%), and Cajun (93.4%, a difference of 0.040%). Similarly, the demographic groups most similar to Hawaiians are Hopi (93.5%, a difference of 0.0%), Immigrants from Uganda (93.5%, a difference of 0.010%), Immigrants from Micronesia (93.5%, a difference of 0.020%), Asian (93.5%, a difference of 0.020%), and Immigrants from Western Asia (93.4%, a difference of 0.020%).
| Demographics | Rating | Rank | 10th Grade |
| Immigrants | Micronesia | 23.2 /100 | #198 | Fair 93.5% |
| Asians | 23.0 /100 | #199 | Fair 93.5% |
| Hopi | 22.2 /100 | #200 | Fair 93.5% |
| Hawaiians | 21.8 /100 | #201 | Fair 93.5% |
| Immigrants | Uganda | 20.9 /100 | #202 | Fair 93.5% |
| Immigrants | Western Asia | 20.6 /100 | #203 | Fair 93.4% |
| Ute | 20.3 /100 | #204 | Fair 93.4% |
| Immigrants | Indonesia | 20.2 /100 | #205 | Fair 93.4% |
| Immigrants | Sudan | 20.0 /100 | #206 | Fair 93.4% |
| Samoans | 19.5 /100 | #207 | Poor 93.4% |
| Immigrants | Syria | 19.4 /100 | #208 | Poor 93.4% |
| Immigrants | Chile | 18.8 /100 | #209 | Poor 93.4% |
| Indians (Asian) | 17.6 /100 | #210 | Poor 93.4% |
| Cajuns | 16.9 /100 | #211 | Poor 93.4% |
| Immigrants | Zaire | 16.7 /100 | #212 | Poor 93.4% |
| Immigrants | Asia | 15.7 /100 | #213 | Poor 93.4% |
| Immigrants | Bahamas | 15.2 /100 | #214 | Poor 93.4% |
| Immigrants | Oceania | 15.1 /100 | #215 | Poor 93.4% |
| Immigrants | Eastern Africa | 14.7 /100 | #216 | Poor 93.4% |
| Portuguese | 12.1 /100 | #217 | Poor 93.3% |
| Immigrants | Liberia | 10.2 /100 | #218 | Poor 93.3% |