Immigrants from Portugal vs Uruguayan 10th Grade
COMPARE
Immigrants from Portugal
Uruguayan
10th Grade
10th Grade Comparison
Immigrants from Portugal
Uruguayans
90.8%
10TH GRADE
0.0/ 100
METRIC RATING
312th/ 347
METRIC RANK
92.9%
10TH GRADE
1.8/ 100
METRIC RATING
245th/ 347
METRIC RANK
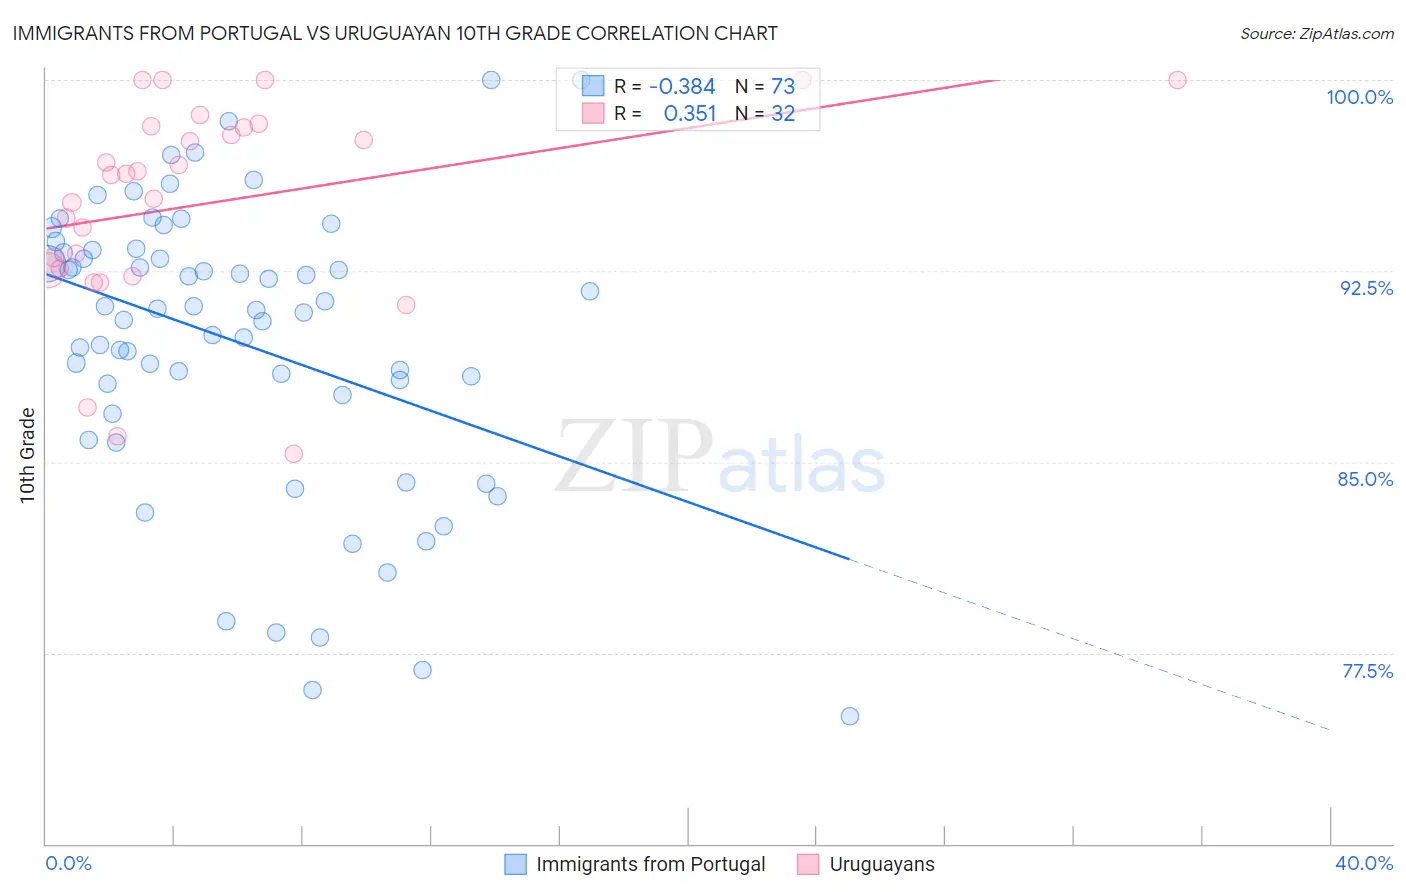
Immigrants from Portugal vs Uruguayan 10th Grade Correlation Chart
The statistical analysis conducted on geographies consisting of 174,792,107 people shows a mild negative correlation between the proportion of Immigrants from Portugal and percentage of population with at least 10th grade education in the United States with a correlation coefficient (R) of -0.384 and weighted average of 90.8%. Similarly, the statistical analysis conducted on geographies consisting of 144,782,794 people shows a mild positive correlation between the proportion of Uruguayans and percentage of population with at least 10th grade education in the United States with a correlation coefficient (R) of 0.351 and weighted average of 92.9%, a difference of 2.3%.
10th Grade Correlation Summary
| Measurement | Immigrants from Portugal | Uruguayan |
| Minimum | 75.0% | 85.3% |
| Maximum | 100.0% | 100.0% |
| Range | 25.0% | 14.7% |
| Mean | 89.7% | 95.2% |
| Median | 91.0% | 96.3% |
| Interquartile 25% (IQ1) | 87.3% | 92.6% |
| Interquartile 75% (IQ3) | 93.3% | 98.1% |
| Interquartile Range (IQR) | 6.0% | 5.6% |
| Standard Deviation (Sample) | 5.6% | 4.0% |
| Standard Deviation (Population) | 5.6% | 3.9% |
Similar Demographics by 10th Grade
Demographics Similar to Immigrants from Portugal by 10th Grade
In terms of 10th grade, the demographic groups most similar to Immigrants from Portugal are Cape Verdean (90.8%, a difference of 0.030%), Nepalese (90.7%, a difference of 0.11%), Immigrants from Cambodia (90.9%, a difference of 0.16%), Vietnamese (90.9%, a difference of 0.19%), and Immigrants from Caribbean (90.6%, a difference of 0.19%).
| Demographics | Rating | Rank | 10th Grade |
| Immigrants | Dominica | 0.0 /100 | #305 | Tragic 91.1% |
| Yaqui | 0.0 /100 | #306 | Tragic 91.1% |
| Immigrants | Fiji | 0.0 /100 | #307 | Tragic 91.0% |
| Immigrants | Bangladesh | 0.0 /100 | #308 | Tragic 91.0% |
| Immigrants | Immigrants | 0.0 /100 | #309 | Tragic 91.0% |
| Vietnamese | 0.0 /100 | #310 | Tragic 90.9% |
| Immigrants | Cambodia | 0.0 /100 | #311 | Tragic 90.9% |
| Immigrants | Portugal | 0.0 /100 | #312 | Tragic 90.8% |
| Cape Verdeans | 0.0 /100 | #313 | Tragic 90.8% |
| Nepalese | 0.0 /100 | #314 | Tragic 90.7% |
| Immigrants | Caribbean | 0.0 /100 | #315 | Tragic 90.6% |
| Ecuadorians | 0.0 /100 | #316 | Tragic 90.6% |
| Immigrants | Ecuador | 0.0 /100 | #317 | Tragic 90.4% |
| Immigrants | Cuba | 0.0 /100 | #318 | Tragic 90.2% |
| Nicaraguans | 0.0 /100 | #319 | Tragic 90.2% |
Demographics Similar to Uruguayans by 10th Grade
In terms of 10th grade, the demographic groups most similar to Uruguayans are Immigrants from Middle Africa (92.9%, a difference of 0.020%), Spanish American (92.9%, a difference of 0.030%), Senegalese (93.0%, a difference of 0.060%), Immigrants from Afghanistan (92.8%, a difference of 0.060%), and Colombian (92.8%, a difference of 0.070%).
| Demographics | Rating | Rank | 10th Grade |
| Nigerians | 4.2 /100 | #238 | Tragic 93.1% |
| Costa Ricans | 4.2 /100 | #239 | Tragic 93.1% |
| Immigrants | Hong Kong | 4.2 /100 | #240 | Tragic 93.1% |
| Immigrants | Somalia | 2.7 /100 | #241 | Tragic 93.0% |
| Immigrants | Cameroon | 2.6 /100 | #242 | Tragic 93.0% |
| Senegalese | 2.4 /100 | #243 | Tragic 93.0% |
| Spanish Americans | 2.1 /100 | #244 | Tragic 92.9% |
| Uruguayans | 1.8 /100 | #245 | Tragic 92.9% |
| Immigrants | Middle Africa | 1.7 /100 | #246 | Tragic 92.9% |
| Immigrants | Afghanistan | 1.4 /100 | #247 | Tragic 92.8% |
| Colombians | 1.4 /100 | #248 | Tragic 92.8% |
| Immigrants | Senegal | 1.4 /100 | #249 | Tragic 92.8% |
| Jamaicans | 1.2 /100 | #250 | Tragic 92.8% |
| Immigrants | Thailand | 1.0 /100 | #251 | Tragic 92.8% |
| South Americans | 0.9 /100 | #252 | Tragic 92.8% |