Immigrants from Portugal vs Australian 10th Grade
COMPARE
Immigrants from Portugal
Australian
10th Grade
10th Grade Comparison
Immigrants from Portugal
Australians
90.8%
10TH GRADE
0.0/ 100
METRIC RATING
312th/ 347
METRIC RANK
95.1%
10TH GRADE
99.9/ 100
METRIC RATING
48th/ 347
METRIC RANK
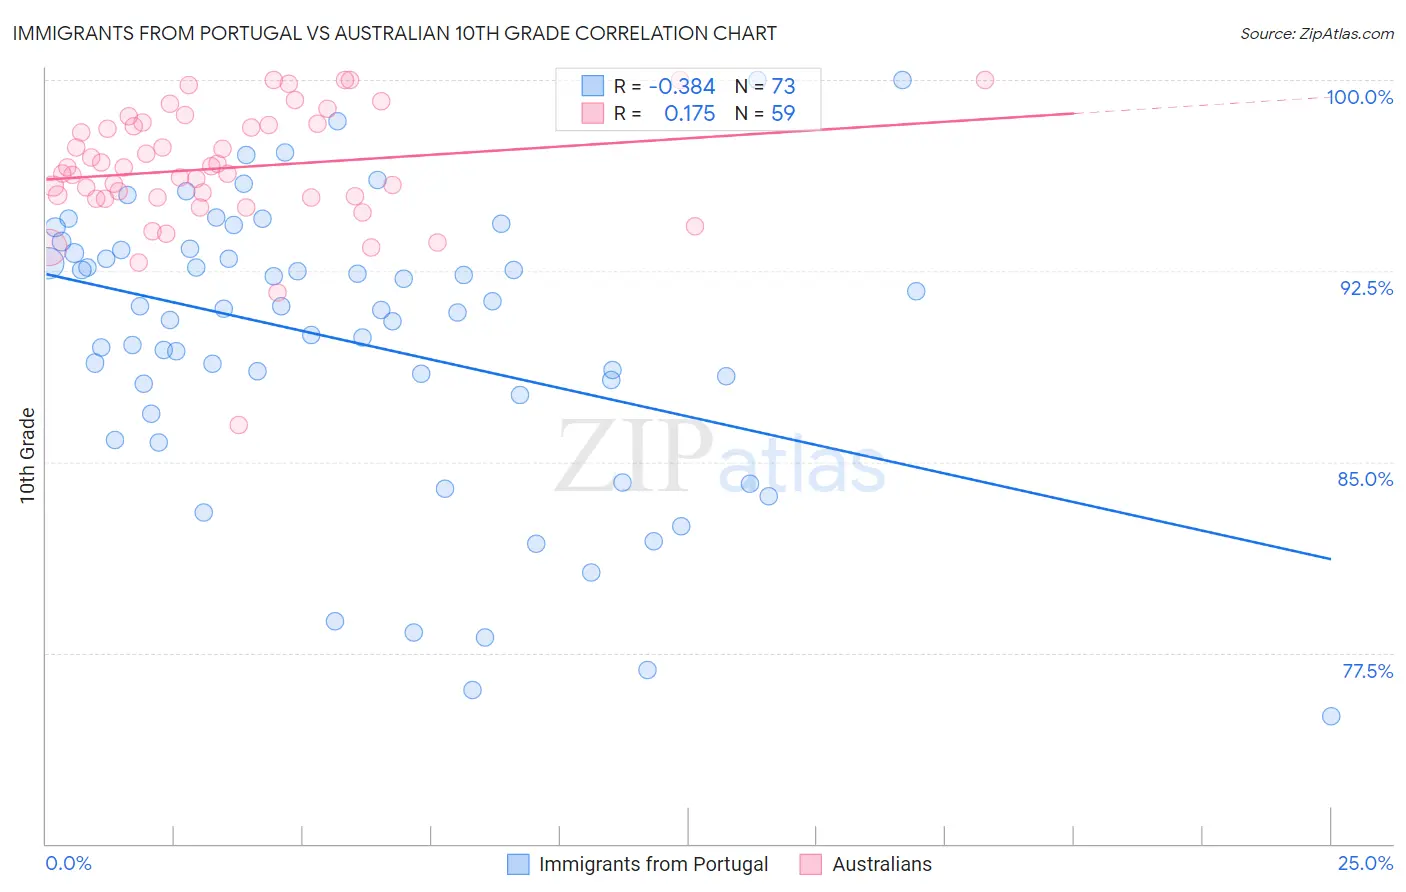
Immigrants from Portugal vs Australian 10th Grade Correlation Chart
The statistical analysis conducted on geographies consisting of 174,792,107 people shows a mild negative correlation between the proportion of Immigrants from Portugal and percentage of population with at least 10th grade education in the United States with a correlation coefficient (R) of -0.384 and weighted average of 90.8%. Similarly, the statistical analysis conducted on geographies consisting of 224,153,693 people shows a poor positive correlation between the proportion of Australians and percentage of population with at least 10th grade education in the United States with a correlation coefficient (R) of 0.175 and weighted average of 95.1%, a difference of 4.8%.
10th Grade Correlation Summary
| Measurement | Immigrants from Portugal | Australian |
| Minimum | 75.0% | 86.5% |
| Maximum | 100.0% | 100.0% |
| Range | 25.0% | 13.5% |
| Mean | 89.7% | 96.5% |
| Median | 91.0% | 96.5% |
| Interquartile 25% (IQ1) | 87.3% | 95.4% |
| Interquartile 75% (IQ3) | 93.3% | 98.3% |
| Interquartile Range (IQR) | 6.0% | 2.9% |
| Standard Deviation (Sample) | 5.6% | 2.4% |
| Standard Deviation (Population) | 5.6% | 2.4% |
Similar Demographics by 10th Grade
Demographics Similar to Immigrants from Portugal by 10th Grade
In terms of 10th grade, the demographic groups most similar to Immigrants from Portugal are Cape Verdean (90.8%, a difference of 0.030%), Nepalese (90.7%, a difference of 0.11%), Immigrants from Cambodia (90.9%, a difference of 0.16%), Vietnamese (90.9%, a difference of 0.19%), and Immigrants from Caribbean (90.6%, a difference of 0.19%).
| Demographics | Rating | Rank | 10th Grade |
| Immigrants | Dominica | 0.0 /100 | #305 | Tragic 91.1% |
| Yaqui | 0.0 /100 | #306 | Tragic 91.1% |
| Immigrants | Fiji | 0.0 /100 | #307 | Tragic 91.0% |
| Immigrants | Bangladesh | 0.0 /100 | #308 | Tragic 91.0% |
| Immigrants | Immigrants | 0.0 /100 | #309 | Tragic 91.0% |
| Vietnamese | 0.0 /100 | #310 | Tragic 90.9% |
| Immigrants | Cambodia | 0.0 /100 | #311 | Tragic 90.9% |
| Immigrants | Portugal | 0.0 /100 | #312 | Tragic 90.8% |
| Cape Verdeans | 0.0 /100 | #313 | Tragic 90.8% |
| Nepalese | 0.0 /100 | #314 | Tragic 90.7% |
| Immigrants | Caribbean | 0.0 /100 | #315 | Tragic 90.6% |
| Ecuadorians | 0.0 /100 | #316 | Tragic 90.6% |
| Immigrants | Ecuador | 0.0 /100 | #317 | Tragic 90.4% |
| Immigrants | Cuba | 0.0 /100 | #318 | Tragic 90.2% |
| Nicaraguans | 0.0 /100 | #319 | Tragic 90.2% |
Demographics Similar to Australians by 10th Grade
In terms of 10th grade, the demographic groups most similar to Australians are Czechoslovakian (95.1%, a difference of 0.020%), Serbian (95.1%, a difference of 0.020%), Immigrants from Northern Europe (95.2%, a difference of 0.030%), Greek (95.2%, a difference of 0.030%), and Immigrants from Austria (95.1%, a difference of 0.030%).
| Demographics | Rating | Rank | 10th Grade |
| Russians | 99.9 /100 | #41 | Exceptional 95.2% |
| Slavs | 99.9 /100 | #42 | Exceptional 95.2% |
| Macedonians | 99.9 /100 | #43 | Exceptional 95.2% |
| Immigrants | Northern Europe | 99.9 /100 | #44 | Exceptional 95.2% |
| Greeks | 99.9 /100 | #45 | Exceptional 95.2% |
| Czechoslovakians | 99.9 /100 | #46 | Exceptional 95.1% |
| Serbians | 99.9 /100 | #47 | Exceptional 95.1% |
| Australians | 99.9 /100 | #48 | Exceptional 95.1% |
| Immigrants | Austria | 99.9 /100 | #49 | Exceptional 95.1% |
| Immigrants | Canada | 99.8 /100 | #50 | Exceptional 95.1% |
| Austrians | 99.8 /100 | #51 | Exceptional 95.1% |
| Ottawa | 99.8 /100 | #52 | Exceptional 95.1% |
| Immigrants | North America | 99.8 /100 | #53 | Exceptional 95.0% |
| Immigrants | Lithuania | 99.8 /100 | #54 | Exceptional 95.0% |
| Immigrants | Ireland | 99.8 /100 | #55 | Exceptional 95.0% |