Immigrants from Portugal vs Navajo 5th Grade
COMPARE
Immigrants from Portugal
Navajo
5th Grade
5th Grade Comparison
Immigrants from Portugal
Navajo
95.9%
5TH GRADE
0.0/ 100
METRIC RATING
314th/ 347
METRIC RANK
97.2%
5TH GRADE
29.0/ 100
METRIC RATING
193rd/ 347
METRIC RANK
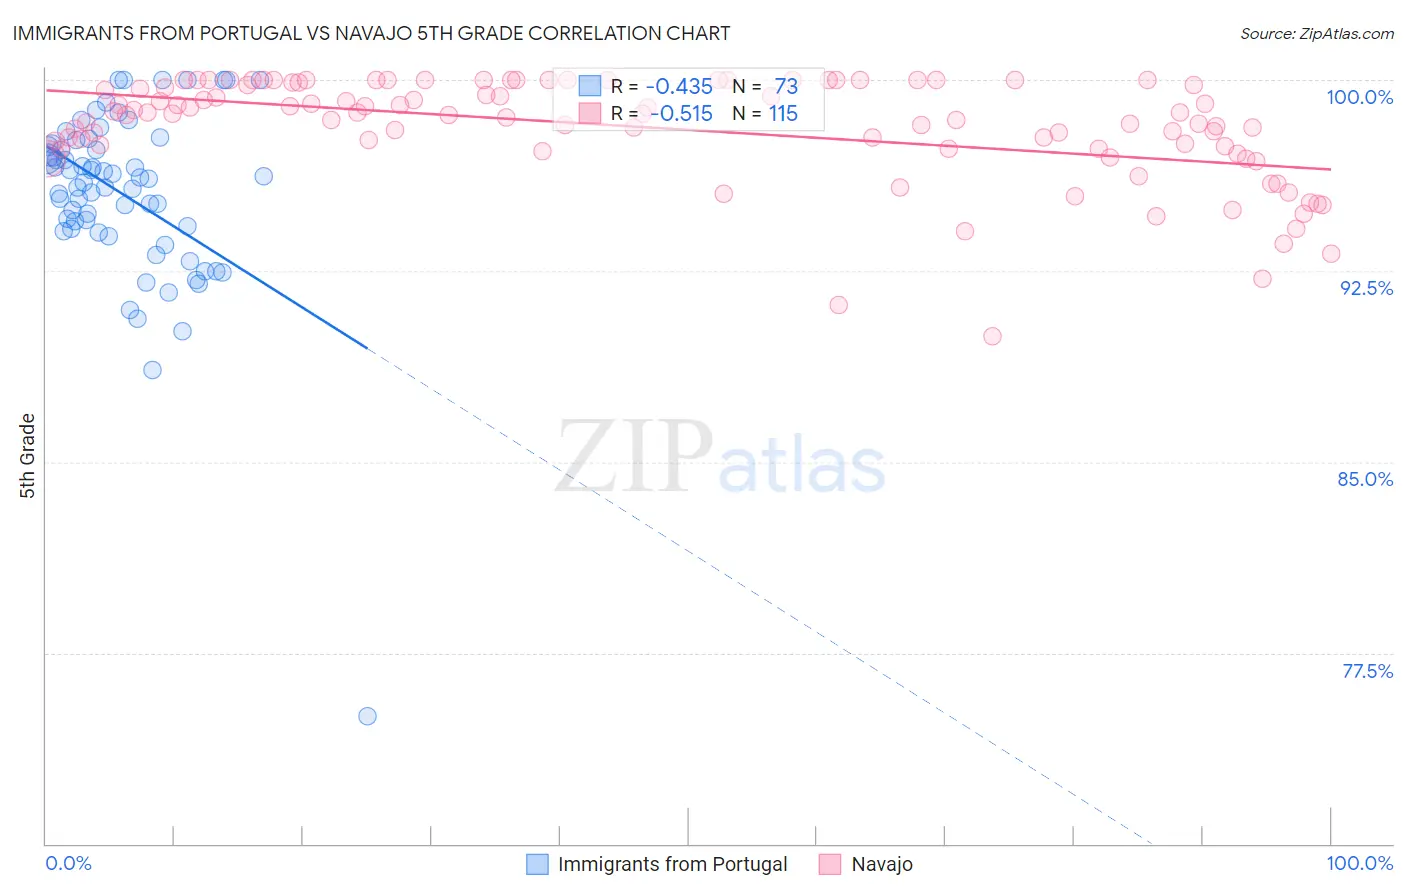
Immigrants from Portugal vs Navajo 5th Grade Correlation Chart
The statistical analysis conducted on geographies consisting of 174,792,107 people shows a moderate negative correlation between the proportion of Immigrants from Portugal and percentage of population with at least 5th grade education in the United States with a correlation coefficient (R) of -0.435 and weighted average of 95.9%. Similarly, the statistical analysis conducted on geographies consisting of 224,872,927 people shows a substantial negative correlation between the proportion of Navajo and percentage of population with at least 5th grade education in the United States with a correlation coefficient (R) of -0.515 and weighted average of 97.2%, a difference of 1.4%.
5th Grade Correlation Summary
| Measurement | Immigrants from Portugal | Navajo |
| Minimum | 75.0% | 89.9% |
| Maximum | 100.0% | 100.0% |
| Range | 25.0% | 10.1% |
| Mean | 95.5% | 98.1% |
| Median | 96.1% | 98.7% |
| Interquartile 25% (IQ1) | 94.1% | 97.3% |
| Interquartile 75% (IQ3) | 97.5% | 99.9% |
| Interquartile Range (IQR) | 3.4% | 2.6% |
| Standard Deviation (Sample) | 3.5% | 2.0% |
| Standard Deviation (Population) | 3.5% | 2.0% |
Similar Demographics by 5th Grade
Demographics Similar to Immigrants from Portugal by 5th Grade
In terms of 5th grade, the demographic groups most similar to Immigrants from Portugal are Bangladeshi (95.9%, a difference of 0.0%), Vietnamese (95.9%, a difference of 0.020%), Nicaraguan (95.9%, a difference of 0.020%), Immigrants from Bangladesh (96.0%, a difference of 0.050%), and Indonesian (96.0%, a difference of 0.070%).
| Demographics | Rating | Rank | 5th Grade |
| Immigrants | Caribbean | 0.0 /100 | #307 | Tragic 96.0% |
| Ecuadorians | 0.0 /100 | #308 | Tragic 96.0% |
| Immigrants | Guyana | 0.0 /100 | #309 | Tragic 96.0% |
| Indonesians | 0.0 /100 | #310 | Tragic 96.0% |
| Immigrants | Bangladesh | 0.0 /100 | #311 | Tragic 96.0% |
| Vietnamese | 0.0 /100 | #312 | Tragic 95.9% |
| Bangladeshis | 0.0 /100 | #313 | Tragic 95.9% |
| Immigrants | Portugal | 0.0 /100 | #314 | Tragic 95.9% |
| Nicaraguans | 0.0 /100 | #315 | Tragic 95.9% |
| Immigrants | Ecuador | 0.0 /100 | #316 | Tragic 95.8% |
| Belizeans | 0.0 /100 | #317 | Tragic 95.8% |
| Immigrants | Vietnam | 0.0 /100 | #318 | Tragic 95.8% |
| Japanese | 0.0 /100 | #319 | Tragic 95.7% |
| Central American Indians | 0.0 /100 | #320 | Tragic 95.7% |
| Immigrants | Belize | 0.0 /100 | #321 | Tragic 95.7% |
Demographics Similar to Navajo by 5th Grade
In terms of 5th grade, the demographic groups most similar to Navajo are Immigrants from Albania (97.2%, a difference of 0.0%), Black/African American (97.3%, a difference of 0.010%), Immigrants from Brazil (97.3%, a difference of 0.010%), Panamanian (97.3%, a difference of 0.010%), and Guamanian/Chamorro (97.2%, a difference of 0.010%).
| Demographics | Rating | Rank | 5th Grade |
| Immigrants | Argentina | 36.1 /100 | #186 | Fair 97.3% |
| Spanish Americans | 34.7 /100 | #187 | Fair 97.3% |
| Paraguayans | 33.7 /100 | #188 | Fair 97.3% |
| Immigrants | Egypt | 32.9 /100 | #189 | Fair 97.3% |
| Blacks/African Americans | 31.8 /100 | #190 | Fair 97.3% |
| Immigrants | Brazil | 31.5 /100 | #191 | Fair 97.3% |
| Panamanians | 31.3 /100 | #192 | Fair 97.3% |
| Navajo | 29.0 /100 | #193 | Fair 97.2% |
| Immigrants | Albania | 28.5 /100 | #194 | Fair 97.2% |
| Guamanians/Chamorros | 26.8 /100 | #195 | Fair 97.2% |
| Hawaiians | 25.6 /100 | #196 | Fair 97.2% |
| Brazilians | 25.4 /100 | #197 | Fair 97.2% |
| Immigrants | Uganda | 21.1 /100 | #198 | Fair 97.2% |
| Natives/Alaskans | 18.0 /100 | #199 | Poor 97.2% |
| Immigrants | Northern Africa | 16.8 /100 | #200 | Poor 97.2% |