Hmong vs Navajo 5th Grade
COMPARE
Hmong
Navajo
5th Grade
5th Grade Comparison
Hmong
Navajo
97.6%
5TH GRADE
92.3/ 100
METRIC RATING
126th/ 347
METRIC RANK
97.2%
5TH GRADE
29.0/ 100
METRIC RATING
193rd/ 347
METRIC RANK
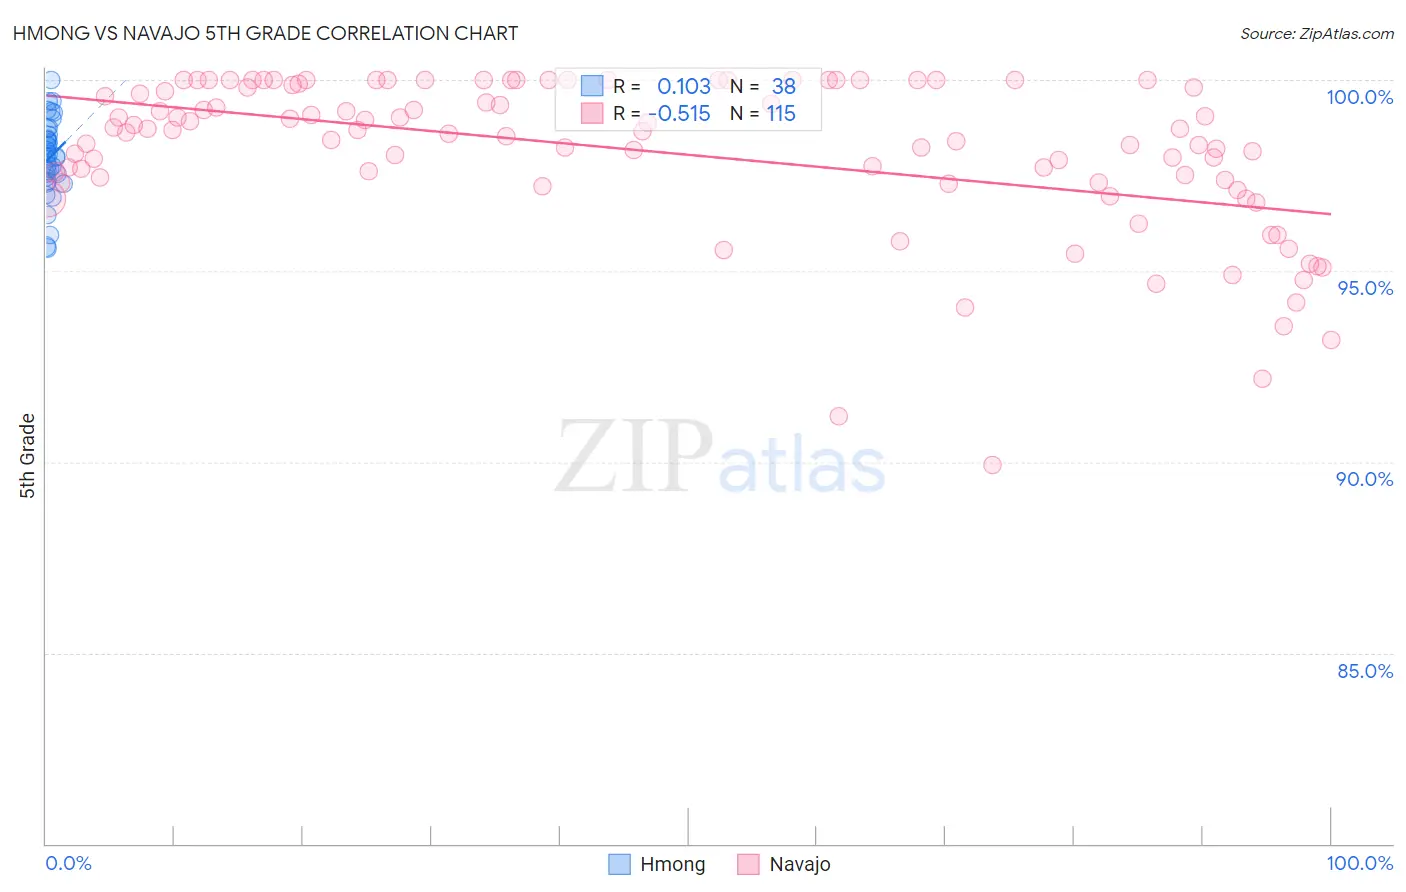
Hmong vs Navajo 5th Grade Correlation Chart
The statistical analysis conducted on geographies consisting of 24,672,093 people shows a poor positive correlation between the proportion of Hmong and percentage of population with at least 5th grade education in the United States with a correlation coefficient (R) of 0.103 and weighted average of 97.6%. Similarly, the statistical analysis conducted on geographies consisting of 224,872,927 people shows a substantial negative correlation between the proportion of Navajo and percentage of population with at least 5th grade education in the United States with a correlation coefficient (R) of -0.515 and weighted average of 97.2%, a difference of 0.35%.
5th Grade Correlation Summary
| Measurement | Hmong | Navajo |
| Minimum | 95.6% | 89.9% |
| Maximum | 100.0% | 100.0% |
| Range | 4.4% | 10.1% |
| Mean | 98.0% | 98.1% |
| Median | 98.0% | 98.7% |
| Interquartile 25% (IQ1) | 97.5% | 97.3% |
| Interquartile 75% (IQ3) | 98.6% | 99.9% |
| Interquartile Range (IQR) | 1.1% | 2.6% |
| Standard Deviation (Sample) | 1.0% | 2.0% |
| Standard Deviation (Population) | 1.0% | 2.0% |
Similar Demographics by 5th Grade
Demographics Similar to Hmong by 5th Grade
In terms of 5th grade, the demographic groups most similar to Hmong are Immigrants from Serbia (97.6%, a difference of 0.0%), Colville (97.6%, a difference of 0.0%), Immigrants from Bulgaria (97.6%, a difference of 0.010%), Immigrants from Europe (97.6%, a difference of 0.010%), and Immigrants from Romania (97.6%, a difference of 0.010%).
| Demographics | Rating | Rank | 5th Grade |
| Syrians | 95.1 /100 | #119 | Exceptional 97.6% |
| Immigrants | Zimbabwe | 94.9 /100 | #120 | Exceptional 97.6% |
| Immigrants | France | 94.8 /100 | #121 | Exceptional 97.6% |
| Immigrants | Japan | 94.7 /100 | #122 | Exceptional 97.6% |
| Immigrants | Norway | 94.6 /100 | #123 | Exceptional 97.6% |
| Spanish | 93.7 /100 | #124 | Exceptional 97.6% |
| Immigrants | Bulgaria | 93.1 /100 | #125 | Exceptional 97.6% |
| Hmong | 92.3 /100 | #126 | Exceptional 97.6% |
| Immigrants | Serbia | 92.3 /100 | #127 | Exceptional 97.6% |
| Colville | 92.0 /100 | #128 | Exceptional 97.6% |
| Immigrants | Europe | 91.9 /100 | #129 | Exceptional 97.6% |
| Immigrants | Romania | 91.6 /100 | #130 | Exceptional 97.6% |
| Pima | 91.2 /100 | #131 | Exceptional 97.6% |
| Immigrants | Kuwait | 90.4 /100 | #132 | Exceptional 97.6% |
| Cambodians | 90.2 /100 | #133 | Exceptional 97.6% |
Demographics Similar to Navajo by 5th Grade
In terms of 5th grade, the demographic groups most similar to Navajo are Immigrants from Albania (97.2%, a difference of 0.0%), Black/African American (97.3%, a difference of 0.010%), Immigrants from Brazil (97.3%, a difference of 0.010%), Panamanian (97.3%, a difference of 0.010%), and Guamanian/Chamorro (97.2%, a difference of 0.010%).
| Demographics | Rating | Rank | 5th Grade |
| Immigrants | Argentina | 36.1 /100 | #186 | Fair 97.3% |
| Spanish Americans | 34.7 /100 | #187 | Fair 97.3% |
| Paraguayans | 33.7 /100 | #188 | Fair 97.3% |
| Immigrants | Egypt | 32.9 /100 | #189 | Fair 97.3% |
| Blacks/African Americans | 31.8 /100 | #190 | Fair 97.3% |
| Immigrants | Brazil | 31.5 /100 | #191 | Fair 97.3% |
| Panamanians | 31.3 /100 | #192 | Fair 97.3% |
| Navajo | 29.0 /100 | #193 | Fair 97.2% |
| Immigrants | Albania | 28.5 /100 | #194 | Fair 97.2% |
| Guamanians/Chamorros | 26.8 /100 | #195 | Fair 97.2% |
| Hawaiians | 25.6 /100 | #196 | Fair 97.2% |
| Brazilians | 25.4 /100 | #197 | Fair 97.2% |
| Immigrants | Uganda | 21.1 /100 | #198 | Fair 97.2% |
| Natives/Alaskans | 18.0 /100 | #199 | Poor 97.2% |
| Immigrants | Northern Africa | 16.8 /100 | #200 | Poor 97.2% |