Immigrants from Poland vs Guamanian/Chamorro No Schooling Completed
COMPARE
Immigrants from Poland
Guamanian/Chamorro
No Schooling Completed
No Schooling Completed Comparison
Immigrants from Poland
Guamanians/Chamorros
2.1%
NO SCHOOLING COMPLETED
55.2/ 100
METRIC RATING
171st/ 347
METRIC RANK
2.2%
NO SCHOOLING COMPLETED
29.8/ 100
METRIC RATING
192nd/ 347
METRIC RANK
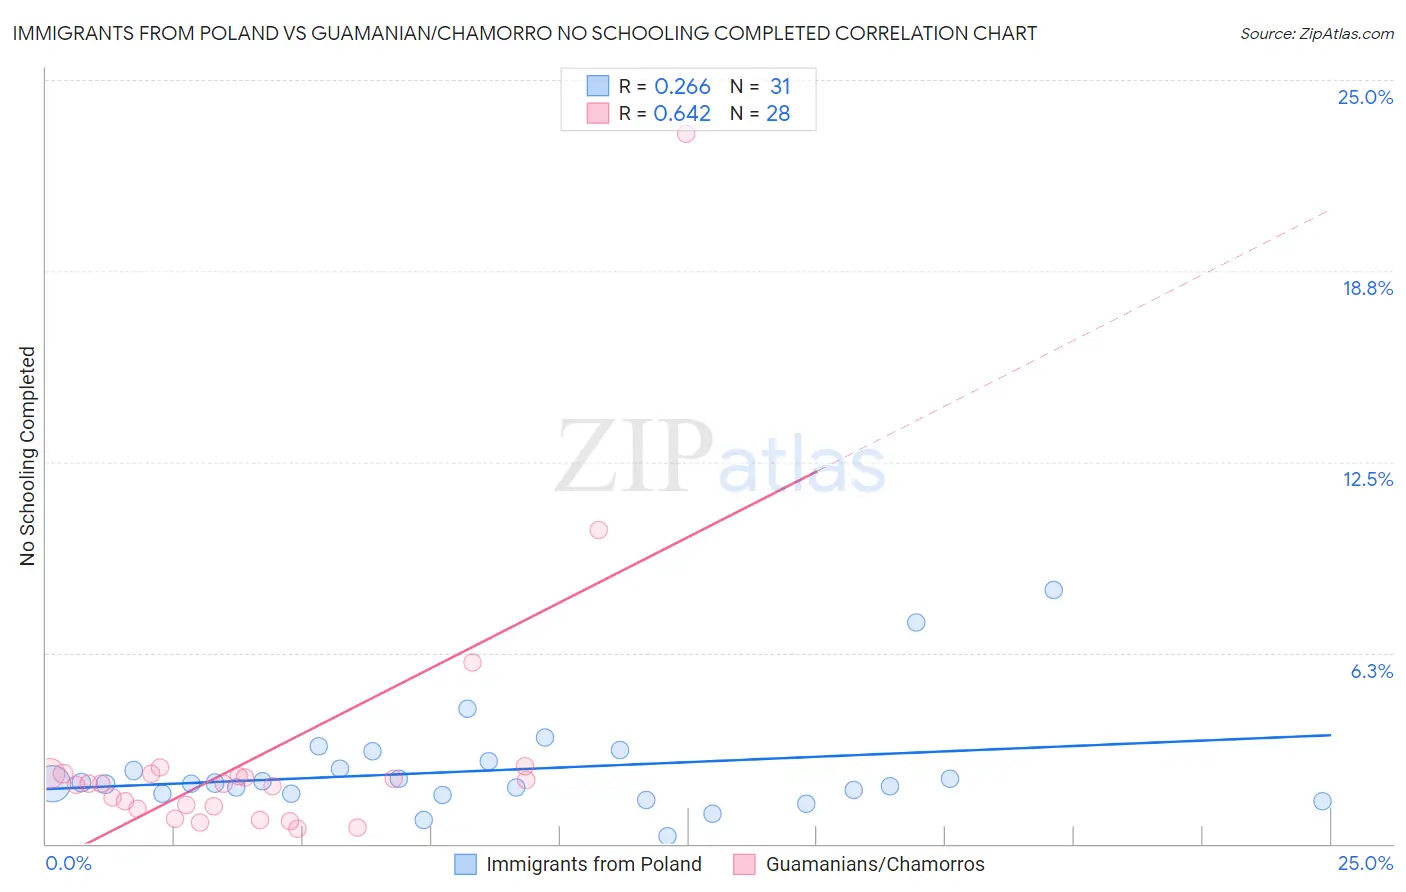
Immigrants from Poland vs Guamanian/Chamorro No Schooling Completed Correlation Chart
The statistical analysis conducted on geographies consisting of 302,129,066 people shows a weak positive correlation between the proportion of Immigrants from Poland and percentage of population with no schooling in the United States with a correlation coefficient (R) of 0.266 and weighted average of 2.1%. Similarly, the statistical analysis conducted on geographies consisting of 220,951,365 people shows a significant positive correlation between the proportion of Guamanians/Chamorros and percentage of population with no schooling in the United States with a correlation coefficient (R) of 0.642 and weighted average of 2.2%, a difference of 3.6%.
No Schooling Completed Correlation Summary
| Measurement | Immigrants from Poland | Guamanian/Chamorro |
| Minimum | 0.25% | 0.47% |
| Maximum | 8.3% | 23.2% |
| Range | 8.0% | 22.8% |
| Mean | 2.4% | 2.9% |
| Median | 2.0% | 2.0% |
| Interquartile 25% (IQ1) | 1.6% | 1.2% |
| Interquartile 75% (IQ3) | 2.7% | 2.3% |
| Interquartile Range (IQR) | 1.0% | 1.1% |
| Standard Deviation (Sample) | 1.7% | 4.4% |
| Standard Deviation (Population) | 1.6% | 4.3% |
Similar Demographics by No Schooling Completed
Demographics Similar to Immigrants from Poland by No Schooling Completed
In terms of no schooling completed, the demographic groups most similar to Immigrants from Poland are Argentinean (2.1%, a difference of 0.11%), Apache (2.1%, a difference of 0.20%), Immigrants from Argentina (2.1%, a difference of 0.33%), Immigrants from Belarus (2.1%, a difference of 0.46%), and Cheyenne (2.1%, a difference of 0.47%).
| Demographics | Rating | Rank | No Schooling Completed |
| Comanche | 60.7 /100 | #164 | Good 2.1% |
| Brazilians | 60.2 /100 | #165 | Good 2.1% |
| Dutch West Indians | 59.9 /100 | #166 | Average 2.1% |
| Egyptians | 59.2 /100 | #167 | Average 2.1% |
| Cheyenne | 58.6 /100 | #168 | Average 2.1% |
| Apache | 56.7 /100 | #169 | Average 2.1% |
| Argentineans | 56.0 /100 | #170 | Average 2.1% |
| Immigrants | Poland | 55.2 /100 | #171 | Average 2.1% |
| Immigrants | Argentina | 52.7 /100 | #172 | Average 2.1% |
| Immigrants | Belarus | 51.8 /100 | #173 | Average 2.1% |
| Immigrants | Micronesia | 50.0 /100 | #174 | Average 2.1% |
| Arabs | 46.4 /100 | #175 | Average 2.1% |
| Panamanians | 45.2 /100 | #176 | Average 2.1% |
| Arapaho | 45.0 /100 | #177 | Average 2.1% |
| Pakistanis | 44.7 /100 | #178 | Average 2.1% |
Demographics Similar to Guamanians/Chamorros by No Schooling Completed
In terms of no schooling completed, the demographic groups most similar to Guamanians/Chamorros are Paraguayan (2.2%, a difference of 0.080%), Bermudan (2.1%, a difference of 0.14%), Immigrants from Albania (2.2%, a difference of 0.24%), Spanish American (2.1%, a difference of 0.43%), and Hawaiian (2.2%, a difference of 0.44%).
| Demographics | Rating | Rank | No Schooling Completed |
| Mongolians | 40.8 /100 | #185 | Average 2.1% |
| Immigrants | Bosnia and Herzegovina | 38.6 /100 | #186 | Fair 2.1% |
| Navajo | 36.5 /100 | #187 | Fair 2.1% |
| Immigrants | Kenya | 36.2 /100 | #188 | Fair 2.1% |
| Immigrants | Egypt | 36.1 /100 | #189 | Fair 2.1% |
| Spanish Americans | 32.6 /100 | #190 | Fair 2.1% |
| Bermudans | 30.7 /100 | #191 | Fair 2.1% |
| Guamanians/Chamorros | 29.8 /100 | #192 | Fair 2.2% |
| Paraguayans | 29.3 /100 | #193 | Fair 2.2% |
| Immigrants | Albania | 28.3 /100 | #194 | Fair 2.2% |
| Hawaiians | 27.0 /100 | #195 | Fair 2.2% |
| Immigrants | Ukraine | 26.1 /100 | #196 | Fair 2.2% |
| Immigrants | Southern Europe | 23.8 /100 | #197 | Fair 2.2% |
| Immigrants | Chile | 22.7 /100 | #198 | Fair 2.2% |
| Africans | 21.8 /100 | #199 | Fair 2.2% |