Immigrants from Northern Africa vs Guamanian/Chamorro No Schooling Completed
COMPARE
Immigrants from Northern Africa
Guamanian/Chamorro
No Schooling Completed
No Schooling Completed Comparison
Immigrants from Northern Africa
Guamanians/Chamorros
2.2%
NO SCHOOLING COMPLETED
19.5/ 100
METRIC RATING
200th/ 347
METRIC RANK
2.2%
NO SCHOOLING COMPLETED
29.8/ 100
METRIC RATING
192nd/ 347
METRIC RANK
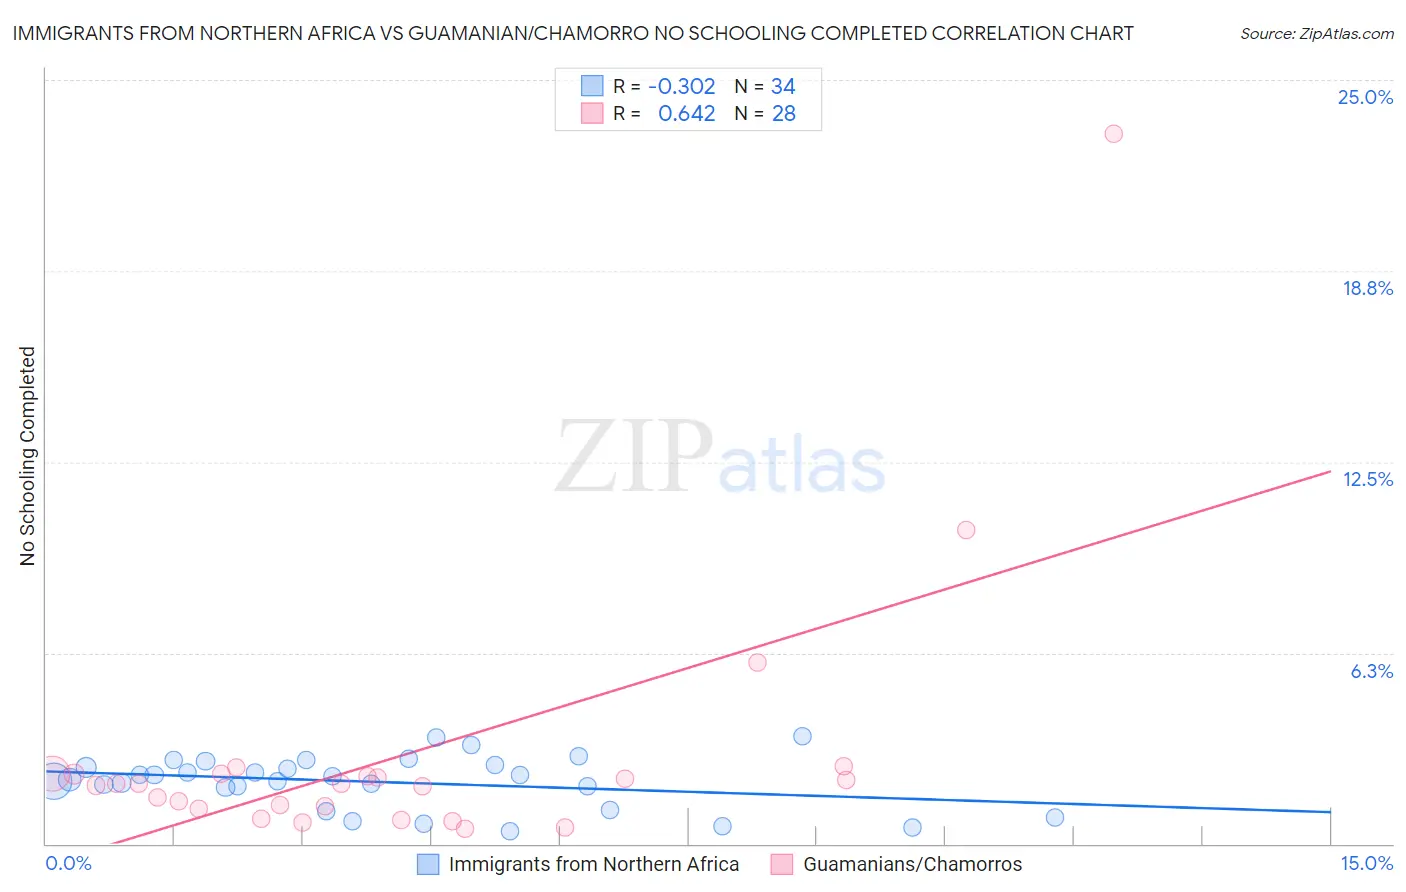
Immigrants from Northern Africa vs Guamanian/Chamorro No Schooling Completed Correlation Chart
The statistical analysis conducted on geographies consisting of 319,330,485 people shows a mild negative correlation between the proportion of Immigrants from Northern Africa and percentage of population with no schooling in the United States with a correlation coefficient (R) of -0.302 and weighted average of 2.2%. Similarly, the statistical analysis conducted on geographies consisting of 220,951,365 people shows a significant positive correlation between the proportion of Guamanians/Chamorros and percentage of population with no schooling in the United States with a correlation coefficient (R) of 0.642 and weighted average of 2.2%, a difference of 1.8%.
No Schooling Completed Correlation Summary
| Measurement | Immigrants from Northern Africa | Guamanian/Chamorro |
| Minimum | 0.40% | 0.47% |
| Maximum | 3.5% | 23.2% |
| Range | 3.1% | 22.8% |
| Mean | 2.0% | 2.9% |
| Median | 2.1% | 2.0% |
| Interquartile 25% (IQ1) | 1.8% | 1.2% |
| Interquartile 75% (IQ3) | 2.6% | 2.3% |
| Interquartile Range (IQR) | 0.74% | 1.1% |
| Standard Deviation (Sample) | 0.84% | 4.4% |
| Standard Deviation (Population) | 0.83% | 4.3% |
Demographics Similar to Immigrants from Northern Africa and Guamanians/Chamorros by No Schooling Completed
In terms of no schooling completed, the demographic groups most similar to Immigrants from Northern Africa are African (2.2%, a difference of 0.46%), Costa Rican (2.2%, a difference of 0.52%), Immigrants from Chile (2.2%, a difference of 0.64%), Immigrants from Southern Europe (2.2%, a difference of 0.82%), and Immigrants from Ukraine (2.2%, a difference of 1.2%). Similarly, the demographic groups most similar to Guamanians/Chamorros are Paraguayan (2.2%, a difference of 0.080%), Bermudan (2.1%, a difference of 0.14%), Immigrants from Albania (2.2%, a difference of 0.24%), Spanish American (2.1%, a difference of 0.43%), and Hawaiian (2.2%, a difference of 0.44%).
| Demographics | Rating | Rank | No Schooling Completed |
| Immigrants | Bosnia and Herzegovina | 38.6 /100 | #186 | Fair 2.1% |
| Navajo | 36.5 /100 | #187 | Fair 2.1% |
| Immigrants | Kenya | 36.2 /100 | #188 | Fair 2.1% |
| Immigrants | Egypt | 36.1 /100 | #189 | Fair 2.1% |
| Spanish Americans | 32.6 /100 | #190 | Fair 2.1% |
| Bermudans | 30.7 /100 | #191 | Fair 2.1% |
| Guamanians/Chamorros | 29.8 /100 | #192 | Fair 2.2% |
| Paraguayans | 29.3 /100 | #193 | Fair 2.2% |
| Immigrants | Albania | 28.3 /100 | #194 | Fair 2.2% |
| Hawaiians | 27.0 /100 | #195 | Fair 2.2% |
| Immigrants | Ukraine | 26.1 /100 | #196 | Fair 2.2% |
| Immigrants | Southern Europe | 23.8 /100 | #197 | Fair 2.2% |
| Immigrants | Chile | 22.7 /100 | #198 | Fair 2.2% |
| Africans | 21.8 /100 | #199 | Fair 2.2% |
| Immigrants | Northern Africa | 19.5 /100 | #200 | Poor 2.2% |
| Costa Ricans | 17.1 /100 | #201 | Poor 2.2% |
| Moroccans | 13.7 /100 | #202 | Poor 2.2% |
| Laotians | 13.3 /100 | #203 | Poor 2.2% |
| Hopi | 12.9 /100 | #204 | Poor 2.2% |
| Immigrants | Bahamas | 11.6 /100 | #205 | Poor 2.2% |
| Bahamians | 11.6 /100 | #206 | Poor 2.2% |