Immigrants from Norway vs Slavic 3rd Grade
COMPARE
Immigrants from Norway
Slavic
3rd Grade
3rd Grade Comparison
Immigrants from Norway
Slavs
98.0%
3RD GRADE
95.2/ 100
METRIC RATING
116th/ 347
METRIC RANK
98.3%
3RD GRADE
99.7/ 100
METRIC RATING
57th/ 347
METRIC RANK
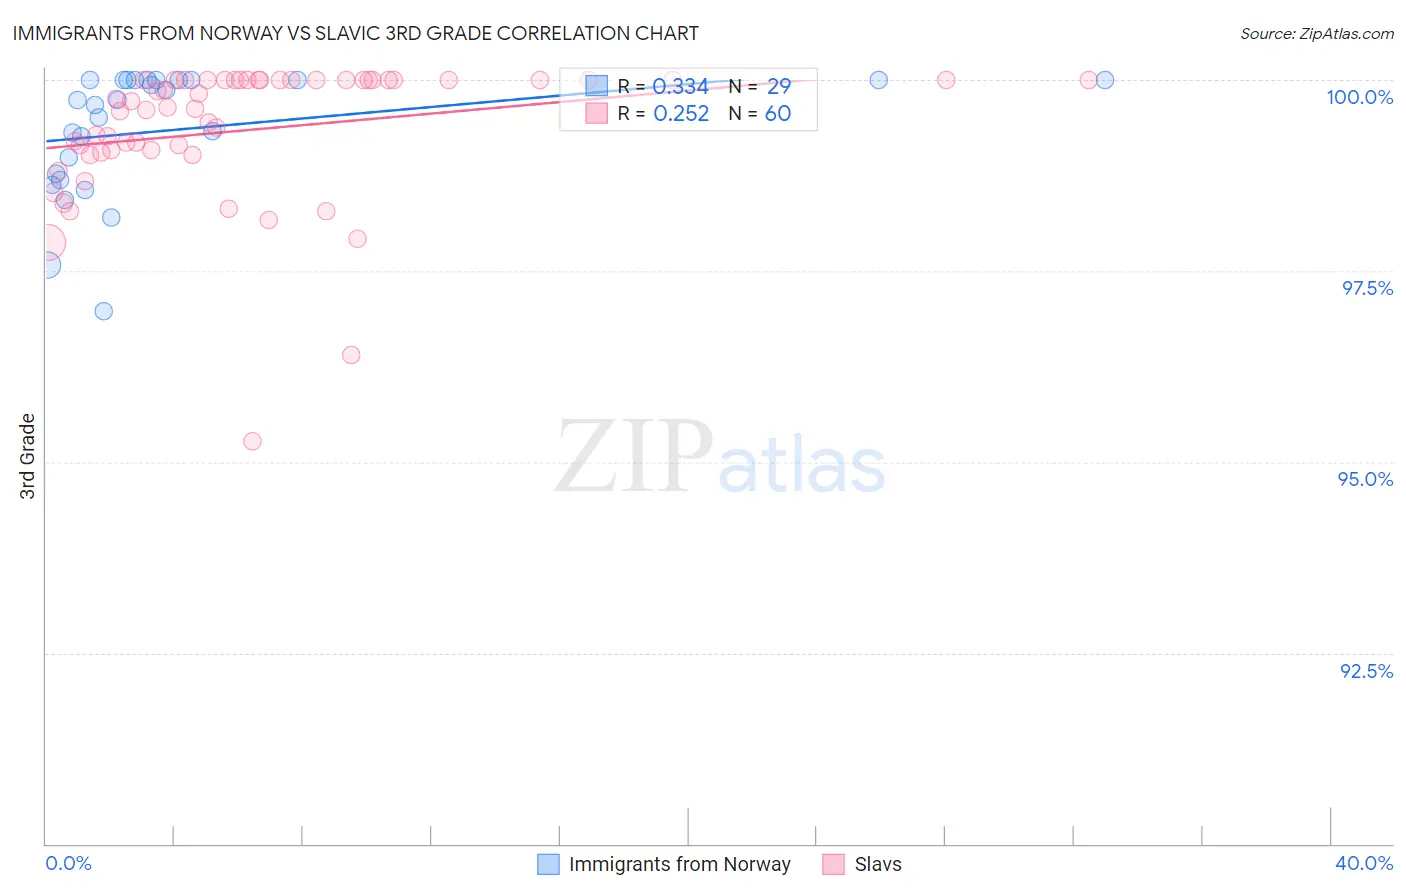
Immigrants from Norway vs Slavic 3rd Grade Correlation Chart
The statistical analysis conducted on geographies consisting of 116,716,420 people shows a mild positive correlation between the proportion of Immigrants from Norway and percentage of population with at least 3rd grade education in the United States with a correlation coefficient (R) of 0.334 and weighted average of 98.0%. Similarly, the statistical analysis conducted on geographies consisting of 270,869,056 people shows a weak positive correlation between the proportion of Slavs and percentage of population with at least 3rd grade education in the United States with a correlation coefficient (R) of 0.252 and weighted average of 98.3%, a difference of 0.25%.
3rd Grade Correlation Summary
| Measurement | Immigrants from Norway | Slavic |
| Minimum | 97.0% | 95.3% |
| Maximum | 100.0% | 100.0% |
| Range | 3.0% | 4.7% |
| Mean | 99.4% | 99.3% |
| Median | 99.7% | 99.7% |
| Interquartile 25% (IQ1) | 98.7% | 99.1% |
| Interquartile 75% (IQ3) | 100.0% | 100.0% |
| Interquartile Range (IQR) | 1.3% | 0.93% |
| Standard Deviation (Sample) | 0.82% | 0.91% |
| Standard Deviation (Population) | 0.80% | 0.91% |
Similar Demographics by 3rd Grade
Demographics Similar to Immigrants from Norway by 3rd Grade
In terms of 3rd grade, the demographic groups most similar to Immigrants from Norway are Menominee (98.0%, a difference of 0.0%), Okinawan (98.0%, a difference of 0.0%), Immigrants from France (98.0%, a difference of 0.0%), Iranian (98.0%, a difference of 0.0%), and Thai (98.0%, a difference of 0.010%).
| Demographics | Rating | Rank | 3rd Grade |
| Pima | 96.7 /100 | #109 | Exceptional 98.0% |
| Immigrants | Switzerland | 96.6 /100 | #110 | Exceptional 98.0% |
| Basques | 96.5 /100 | #111 | Exceptional 98.0% |
| Immigrants | Latvia | 96.0 /100 | #112 | Exceptional 98.0% |
| Thais | 95.5 /100 | #113 | Exceptional 98.0% |
| Menominee | 95.4 /100 | #114 | Exceptional 98.0% |
| Okinawans | 95.2 /100 | #115 | Exceptional 98.0% |
| Immigrants | Norway | 95.2 /100 | #116 | Exceptional 98.0% |
| Immigrants | France | 95.1 /100 | #117 | Exceptional 98.0% |
| Iranians | 94.9 /100 | #118 | Exceptional 98.0% |
| Spanish | 94.8 /100 | #119 | Exceptional 98.0% |
| Immigrants | Croatia | 94.4 /100 | #120 | Exceptional 98.0% |
| Iroquois | 94.1 /100 | #121 | Exceptional 98.0% |
| Lebanese | 94.1 /100 | #122 | Exceptional 98.0% |
| Syrians | 93.8 /100 | #123 | Exceptional 98.0% |
Demographics Similar to Slavs by 3rd Grade
In terms of 3rd grade, the demographic groups most similar to Slavs are American (98.3%, a difference of 0.0%), Austrian (98.3%, a difference of 0.0%), Greek (98.3%, a difference of 0.0%), Maltese (98.3%, a difference of 0.0%), and Creek (98.2%, a difference of 0.0%).
| Demographics | Rating | Rank | 3rd Grade |
| Celtics | 99.8 /100 | #50 | Exceptional 98.3% |
| Australians | 99.8 /100 | #51 | Exceptional 98.3% |
| Whites/Caucasians | 99.8 /100 | #52 | Exceptional 98.3% |
| Immigrants | Scotland | 99.8 /100 | #53 | Exceptional 98.3% |
| Bulgarians | 99.8 /100 | #54 | Exceptional 98.3% |
| Americans | 99.8 /100 | #55 | Exceptional 98.3% |
| Austrians | 99.8 /100 | #56 | Exceptional 98.3% |
| Slavs | 99.7 /100 | #57 | Exceptional 98.3% |
| Greeks | 99.7 /100 | #58 | Exceptional 98.3% |
| Maltese | 99.7 /100 | #59 | Exceptional 98.3% |
| Creek | 99.7 /100 | #60 | Exceptional 98.2% |
| Pueblo | 99.7 /100 | #61 | Exceptional 98.2% |
| Immigrants | Canada | 99.7 /100 | #62 | Exceptional 98.2% |
| Immigrants | North America | 99.7 /100 | #63 | Exceptional 98.2% |
| Kiowa | 99.6 /100 | #64 | Exceptional 98.2% |