Immigrants from Northern Europe vs Luxembourger GED/Equivalency

COMPARE

Immigrants from Northern Europe
Race
Ancestry
AfghanAfricanAlaska NativeAlaskan AthabascanAlbanianAleutAlsatianAmericanApacheArabArapahoArgentineanArmenianAssyrian/Chaldean/SyriacAustralianAustrianBahamianBangladeshiBarbadianBasqueBelgianBelizeanBermudanBhutaneseBlackfeetBolivianBrazilianBritishBritish West IndianBulgarianBurmeseCajunCambodianCanadianCape VerdeanCarpatho RusynCelticCentral AmericanCentral American IndianCherokeeCheyenneChickasawChileanChineseChippewaChoctawColombianColvilleComancheCosta RicanCreeCreekCroatianCrowCubanCypriotCzechCzechoslovakianDanishDelawareDominicanDutchDutch West IndianEastern EuropeanEcuadorianEgyptianEnglishEstonianEthiopianEuropeanFijianFilipinoFinnishFrenchFrench American IndianFrench CanadianGermanGerman RussianGhanaianGreekGuamanian/ChamorroGuatemalanGuyaneseHaitianHmongHonduranHopiHoumaHungarianIcelanderIndian (Asian)IndonesianInupiatIranianIraqiIrishIroquoisIsraeliItalianJamaicanJapaneseJordanianKenyanKiowaKoreanLaotianLatvianLebaneseLiberianLithuanianLumbeeMacedonianMalaysianMalteseMarshalleseMenomineeMexicanMexican American IndianMongolianMoroccanNative HawaiianNavajoNepaleseNew ZealanderNicaraguanNigerianNorthern EuropeanNorwegianOkinawanOsageOttawaPaiutePakistaniPalestinianPanamanianParaguayanPennsylvania GermanPeruvianPimaPolishPortuguesePotawatomiPuebloPuerto RicanPuget Sound SalishRomanianRussianSalvadoranSamoanScandinavianScotch-IrishScottishSeminoleSenegaleseSerbianShoshoneSierra LeoneanSiouxSlavicSlovakSloveneSomaliSouth AfricanSouth AmericanSouth American IndianSoviet UnionSpaniardSpanishSpanish AmericanSpanish American IndianSri LankanSubsaharan AfricanSudaneseSwedishSwissSyrianTaiwaneseThaiTlingit-HaidaTohono O'OdhamTonganTrinidadian and TobagonianTsimshianTurkishU.S. Virgin IslanderUgandanUkrainianUruguayanUteVenezuelanVietnameseWelshWest IndianYakamaYaquiYugoslavianYumanYup'ikZimbabwean
Immigration
NonimmigrantsImmigrantsAfghanistanAfricaAlbaniaArgentinaArmeniaAsiaAustraliaAustriaBahamasBangladeshBarbadosBelarusBelgiumBelizeBoliviaBosnia and HerzegovinaBrazilBulgariaBurma/MyanmarCabo VerdeCambodiaCameroonCanadaCaribbeanCentral AmericaChileChinaColombiaCongoCosta RicaCroatiaCubaCzechoslovakiaDenmarkDominicaDominican RepublicEastern AfricaEastern AsiaEastern EuropeEcuadorEgyptEl SalvadorEnglandEritreaEthiopiaEuropeFijiFranceGermanyGhanaGreeceGrenadaGuatemalaGuyanaHaitiHondurasHong KongHungaryIndiaIndonesiaIranIraqIrelandIsraelItalyJamaicaJapanJordanKazakhstanKenyaKoreaKuwaitLaosLatin AmericaLatviaLebanonLiberiaLithuaniaMalaysiaMexicoMicronesiaMiddle AfricaMoldovaMoroccoNepalNetherlandsNicaraguaNigeriaNorth AmericaNorth MacedoniaNorthern AfricaNorthern EuropeNorwayOceaniaPakistanPanamaPeruPhilippinesPolandPortugalRomaniaRussiaSaudi ArabiaScotlandSenegalSerbiaSierra LeoneSingaporeSomaliaSouth AfricaSouth AmericaSouth Central AsiaSouth Eastern AsiaSouthern EuropeSpainSri LankaSt. Vincent and the GrenadinesSudanSwedenSwitzerlandSyriaTaiwanThailandTrinidad and TobagoTurkeyUgandaUkraineUruguayUzbekistanVenezuelaVietnamWest IndiesWestern AfricaWestern AsiaWestern EuropeYemenZaireZimbabweAzores
Luxembourger
Race
Ancestry
AfghanAfricanAlaska NativeAlaskan AthabascanAlbanianAleutAlsatianAmericanApacheArabArapahoArgentineanArmenianAssyrian/Chaldean/SyriacAustralianAustrianBahamianBangladeshiBarbadianBasqueBelgianBelizeanBermudanBhutaneseBlackfeetBolivianBrazilianBritishBritish West IndianBulgarianBurmeseCajunCambodianCanadianCape VerdeanCarpatho RusynCelticCentral AmericanCentral American IndianCherokeeCheyenneChickasawChileanChineseChippewaChoctawColombianColvilleComancheCosta RicanCreeCreekCroatianCrowCubanCypriotCzechCzechoslovakianDanishDelawareDominicanDutchDutch West IndianEastern EuropeanEcuadorianEgyptianEnglishEstonianEthiopianEuropeanFijianFilipinoFinnishFrenchFrench American IndianFrench CanadianGermanGerman RussianGhanaianGreekGuamanian/ChamorroGuatemalanGuyaneseHaitianHmongHonduranHopiHoumaHungarianIcelanderIndian (Asian)IndonesianInupiatIranianIraqiIrishIroquoisIsraeliItalianJamaicanJapaneseJordanianKenyanKiowaKoreanLaotianLatvianLebaneseLiberianLithuanianLumbeeLuxembourgerMacedonianMalaysianMalteseMarshalleseMenomineeMexicanMexican American IndianMongolianMoroccanNative HawaiianNavajoNepaleseNew ZealanderNicaraguanNigerianNorthern EuropeanNorwegianOkinawanOsageOttawaPaiutePakistaniPalestinianPanamanianParaguayanPennsylvania GermanPeruvianPimaPolishPortuguesePotawatomiPuebloPuerto RicanPuget Sound SalishRomanianRussianSalvadoranSamoanScandinavianScotch-IrishScottishSeminoleSenegaleseSerbianShoshoneSierra LeoneanSiouxSlavicSlovakSloveneSomaliSouth AfricanSouth AmericanSouth American IndianSoviet UnionSpaniardSpanishSpanish AmericanSpanish American IndianSri LankanSubsaharan AfricanSudaneseSwedishSwissSyrianTaiwaneseThaiTlingit-HaidaTohono O'OdhamTonganTrinidadian and TobagonianTsimshianTurkishU.S. Virgin IslanderUgandanUkrainianUruguayanUteVenezuelanVietnameseWelshWest IndianYakamaYaquiYugoslavianYumanYup'ikZimbabwean
Immigration
NonimmigrantsImmigrantsAfghanistanAfricaAlbaniaArgentinaArmeniaAsiaAustraliaAustriaBahamasBangladeshBarbadosBelarusBelgiumBelizeBoliviaBosnia and HerzegovinaBrazilBulgariaBurma/MyanmarCabo VerdeCambodiaCameroonCanadaCaribbeanCentral AmericaChileChinaColombiaCongoCosta RicaCroatiaCubaCzechoslovakiaDenmarkDominicaDominican RepublicEastern AfricaEastern AsiaEastern EuropeEcuadorEgyptEl SalvadorEnglandEritreaEthiopiaEuropeFijiFranceGermanyGhanaGreeceGrenadaGuatemalaGuyanaHaitiHondurasHong KongHungaryIndiaIndonesiaIranIraqIrelandIsraelItalyJamaicaJapanJordanKazakhstanKenyaKoreaKuwaitLaosLatin AmericaLatviaLebanonLiberiaLithuaniaMalaysiaMexicoMicronesiaMiddle AfricaMoldovaMoroccoNepalNetherlandsNicaraguaNigeriaNorth AmericaNorth MacedoniaNorthern AfricaNorwayOceaniaPakistanPanamaPeruPhilippinesPolandPortugalRomaniaRussiaSaudi ArabiaScotlandSenegalSerbiaSierra LeoneSingaporeSomaliaSouth AfricaSouth AmericaSouth Central AsiaSouth Eastern AsiaSouthern EuropeSpainSri LankaSt. Vincent and the GrenadinesSudanSwedenSwitzerlandSyriaTaiwanThailandTrinidad and TobagoTurkeyUgandaUkraineUruguayUzbekistanVenezuelaVietnamWest IndiesWestern AfricaWestern AsiaWestern EuropeYemenZaireZimbabweAzores
GED/Equivalency
Income
Poverty
Unemployment
Labor Participation
Family Structure
Vehicle Availability
Education Level
Disability

GED/Equivalency Comparison

Immigrants from Northern Europe

Luxembourgers

Exceptional
Exceptional
88.5%
GED/EQUIVALENCY
99.8/ 100
METRIC RATING
28th/ 347
METRIC RANK
88.6%
GED/EQUIVALENCY
99.8/ 100
METRIC RATING
21st/ 347
METRIC RANK

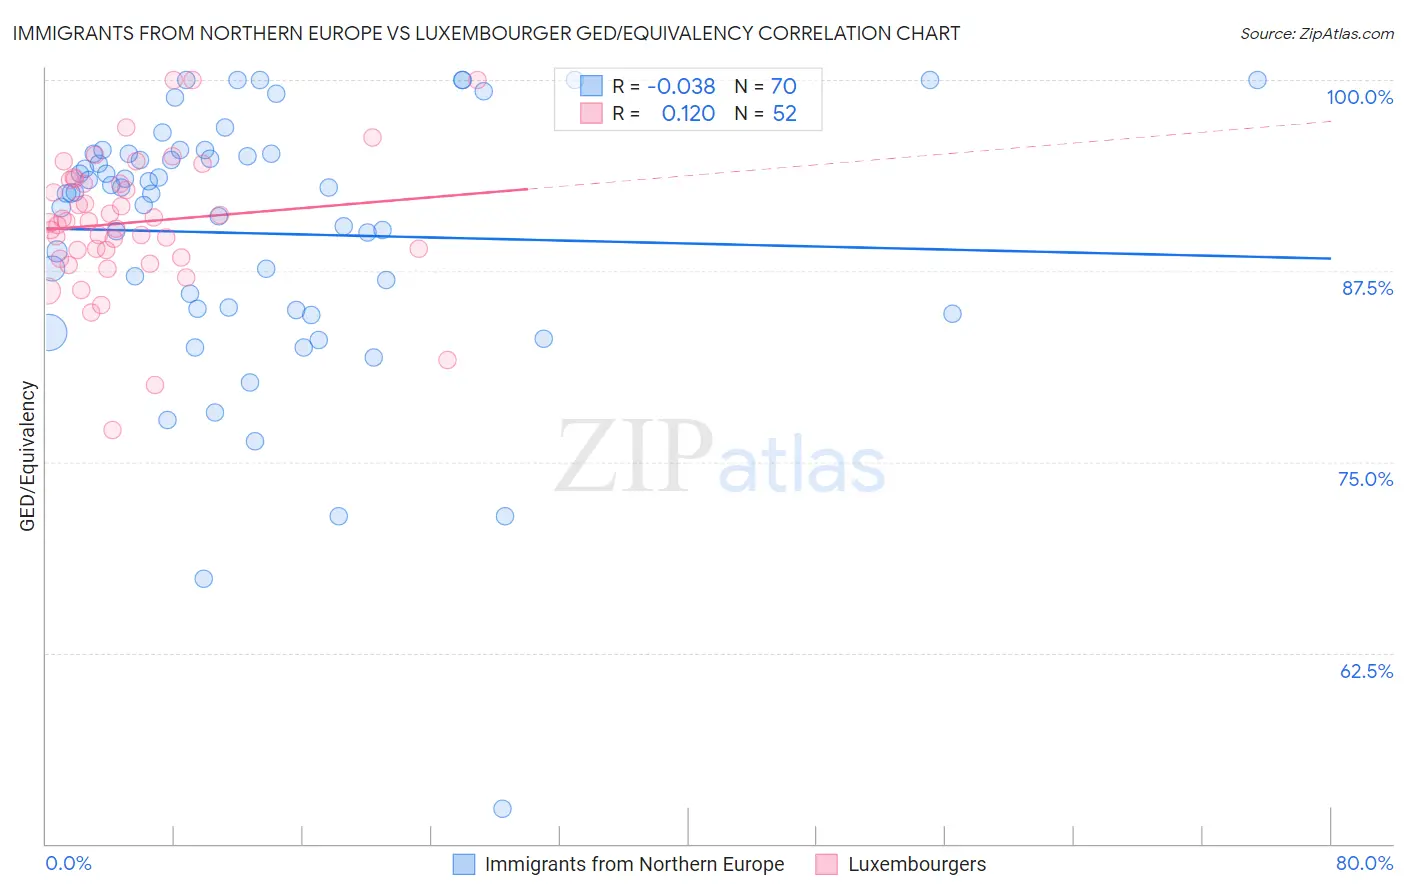
Immigrants from Northern Europe vs Luxembourger GED/Equivalency Correlation Chart

The statistical analysis conducted on geographies consisting of 477,226,871 people shows no correlation between the proportion of Immigrants from Northern Europe and percentage of population with at least ged/equivalency education in the United States with a correlation coefficient (R) of -0.038 and weighted average of 88.5%. Similarly, the statistical analysis conducted on geographies consisting of 144,675,955 people shows a poor positive correlation between the proportion of Luxembourgers and percentage of population with at least ged/equivalency education in the United States with a correlation coefficient (R) of 0.120 and weighted average of 88.6%, a difference of 0.11%.
Immigrants from Northern Europe vs Luxembourger GED/Equivalency

GED/Equivalency Correlation Summary

MeasurementImmigrants from Northern EuropeLuxembourger
Minimum52.3%77.1%
Maximum100.0%100.0%
Range47.7%22.9%
Mean90.0%90.7%
Median92.6%90.7%
Interquartile 25% (IQ1)85.1%88.7%
Interquartile 75% (IQ3)95.2%93.3%
Interquartile Range (IQR)10.2%4.6%
Standard Deviation (Sample)8.7%4.5%
Standard Deviation (Population)8.7%4.4%

Demographics Similar to Immigrants from Northern Europe and Luxembourgers by GED/Equivalency

In terms of ged/equivalency, the demographic groups most similar to Immigrants from Northern Europe are Polish (88.5%, a difference of 0.030%), Immigrants from Lithuania (88.6%, a difference of 0.040%), Turkish (88.5%, a difference of 0.050%), Russian (88.6%, a difference of 0.080%), and Slovak (88.6%, a difference of 0.080%). Similarly, the demographic groups most similar to Luxembourgers are Maltese (88.6%, a difference of 0.010%), Immigrants from Ireland (88.6%, a difference of 0.010%), Russian (88.6%, a difference of 0.030%), Slovak (88.6%, a difference of 0.030%), and Estonian (88.6%, a difference of 0.030%).
DemographicsRating | RankGED/Equivalency
Cypriots
99.9
/100
|
#14
Exceptional
88.9%
Okinawans
99.9
/100
|
#15
Exceptional
88.9%
Immigrants | Taiwan
99.9
/100
|
#16
Exceptional
88.8%
Croatians
99.9
/100
|
#17
Exceptional
88.8%
Slovenes
99.9
/100
|
#18
Exceptional
88.8%
Swedes
99.9
/100
|
#19
Exceptional
88.8%
Maltese
99.9
/100
|
#20
Exceptional
88.6%
Luxembourgers
99.8
/100
|
#21
Exceptional
88.6%
Immigrants | Ireland
99.8
/100
|
#22
Exceptional
88.6%
Russians
99.8
/100
|
#23
Exceptional
88.6%
Slovaks
99.8
/100
|
#24
Exceptional
88.6%
Estonians
99.8
/100
|
#25
Exceptional
88.6%
Immigrants | Australia
99.8
/100
|
#26
Exceptional
88.6%
Immigrants | Lithuania
99.8
/100
|
#27
Exceptional
88.6%
Immigrants | Northern Europe
99.8
/100
|
#28
Exceptional
88.5%
Poles
99.8
/100
|
#29
Exceptional
88.5%
Turks
99.8
/100
|
#30
Exceptional
88.5%
Bhutanese
99.8
/100
|
#31
Exceptional
88.4%
Danes
99.8
/100
|
#32
Exceptional
88.4%
Immigrants | Sweden
99.7
/100
|
#33
Exceptional
88.4%
Immigrants | Japan
99.7
/100
|
#34
Exceptional
88.4%