Immigrants from Northern Africa vs Bhutanese 11th Grade
COMPARE
Immigrants from Northern Africa
Bhutanese
11th Grade
11th Grade Comparison
Immigrants from Northern Africa
Bhutanese
92.6%
11TH GRADE
57.3/ 100
METRIC RATING
170th/ 347
METRIC RANK
94.0%
11TH GRADE
99.8/ 100
METRIC RATING
59th/ 347
METRIC RANK
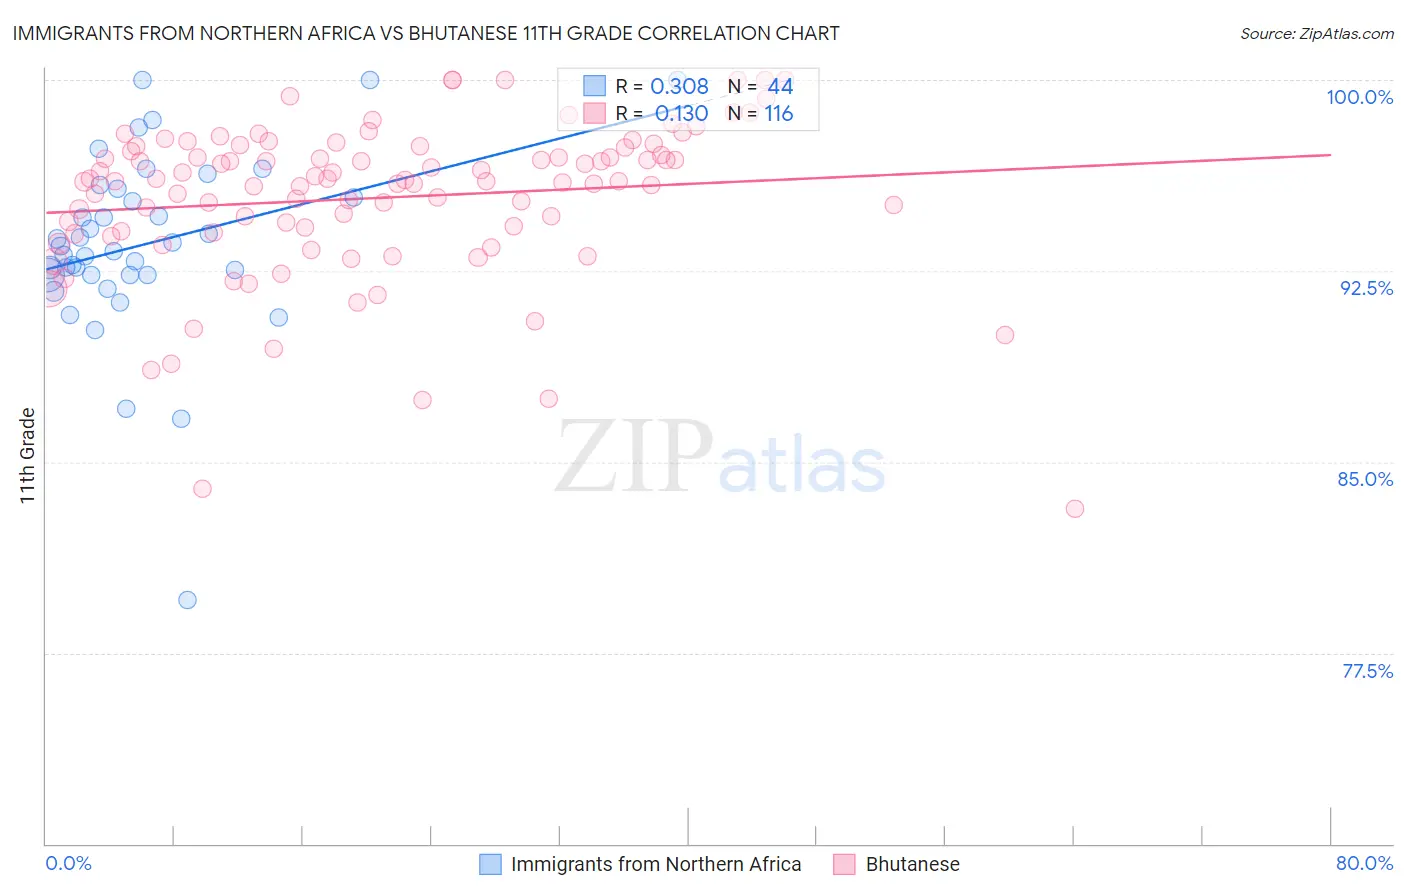
Immigrants from Northern Africa vs Bhutanese 11th Grade Correlation Chart
The statistical analysis conducted on geographies consisting of 321,196,768 people shows a mild positive correlation between the proportion of Immigrants from Northern Africa and percentage of population with at least 11th grade education in the United States with a correlation coefficient (R) of 0.308 and weighted average of 92.6%. Similarly, the statistical analysis conducted on geographies consisting of 455,591,134 people shows a poor positive correlation between the proportion of Bhutanese and percentage of population with at least 11th grade education in the United States with a correlation coefficient (R) of 0.130 and weighted average of 94.0%, a difference of 1.5%.
11th Grade Correlation Summary
| Measurement | Immigrants from Northern Africa | Bhutanese |
| Minimum | 79.6% | 83.2% |
| Maximum | 100.0% | 100.0% |
| Range | 20.4% | 16.8% |
| Mean | 93.6% | 95.4% |
| Median | 93.4% | 96.0% |
| Interquartile 25% (IQ1) | 92.3% | 94.0% |
| Interquartile 75% (IQ3) | 95.6% | 97.3% |
| Interquartile Range (IQR) | 3.2% | 3.3% |
| Standard Deviation (Sample) | 3.6% | 3.1% |
| Standard Deviation (Population) | 3.6% | 3.1% |
Similar Demographics by 11th Grade
Demographics Similar to Immigrants from Northern Africa by 11th Grade
In terms of 11th grade, the demographic groups most similar to Immigrants from Northern Africa are Immigrants from Albania (92.6%, a difference of 0.0%), Sierra Leonean (92.6%, a difference of 0.010%), Alsatian (92.6%, a difference of 0.030%), Laotian (92.6%, a difference of 0.030%), and Bermudan (92.6%, a difference of 0.050%).
| Demographics | Rating | Rank | 11th Grade |
| Immigrants | Nonimmigrants | 66.6 /100 | #163 | Good 92.7% |
| Spanish | 66.2 /100 | #164 | Good 92.7% |
| Immigrants | Iraq | 63.7 /100 | #165 | Good 92.6% |
| Bermudans | 62.3 /100 | #166 | Good 92.6% |
| Alsatians | 60.2 /100 | #167 | Good 92.6% |
| Sierra Leoneans | 58.7 /100 | #168 | Average 92.6% |
| Immigrants | Albania | 57.8 /100 | #169 | Average 92.6% |
| Immigrants | Northern Africa | 57.3 /100 | #170 | Average 92.6% |
| Laotians | 54.4 /100 | #171 | Average 92.6% |
| Immigrants | Pakistan | 52.3 /100 | #172 | Average 92.5% |
| Indians (Asian) | 51.5 /100 | #173 | Average 92.5% |
| Asians | 50.0 /100 | #174 | Average 92.5% |
| Shoshone | 48.9 /100 | #175 | Average 92.5% |
| Spaniards | 46.9 /100 | #176 | Average 92.5% |
| Guamanians/Chamorros | 45.0 /100 | #177 | Average 92.5% |
Demographics Similar to Bhutanese by 11th Grade
In terms of 11th grade, the demographic groups most similar to Bhutanese are French Canadian (94.0%, a difference of 0.0%), New Zealander (94.0%, a difference of 0.0%), Iranian (94.0%, a difference of 0.0%), Okinawan (94.0%, a difference of 0.0%), and Immigrants from North America (94.0%, a difference of 0.010%).
| Demographics | Rating | Rank | 11th Grade |
| Immigrants | Canada | 99.9 /100 | #52 | Exceptional 94.0% |
| Immigrants | Australia | 99.9 /100 | #53 | Exceptional 94.0% |
| Immigrants | North America | 99.9 /100 | #54 | Exceptional 94.0% |
| Czechoslovakians | 99.9 /100 | #55 | Exceptional 94.0% |
| French Canadians | 99.9 /100 | #56 | Exceptional 94.0% |
| New Zealanders | 99.9 /100 | #57 | Exceptional 94.0% |
| Iranians | 99.9 /100 | #58 | Exceptional 94.0% |
| Bhutanese | 99.8 /100 | #59 | Exceptional 94.0% |
| Okinawans | 99.8 /100 | #60 | Exceptional 94.0% |
| Immigrants | Belgium | 99.8 /100 | #61 | Exceptional 94.0% |
| Austrians | 99.8 /100 | #62 | Exceptional 94.0% |
| Ukrainians | 99.8 /100 | #63 | Exceptional 94.0% |
| Immigrants | Sweden | 99.8 /100 | #64 | Exceptional 93.9% |
| Native Hawaiians | 99.8 /100 | #65 | Exceptional 93.9% |
| Alaskan Athabascans | 99.8 /100 | #66 | Exceptional 93.9% |