Immigrants from Morocco vs Bhutanese 11th Grade
COMPARE
Immigrants from Morocco
Bhutanese
11th Grade
11th Grade Comparison
Immigrants from Morocco
Bhutanese
92.4%
11TH GRADE
38.6/ 100
METRIC RATING
182nd/ 347
METRIC RANK
94.0%
11TH GRADE
99.8/ 100
METRIC RATING
59th/ 347
METRIC RANK
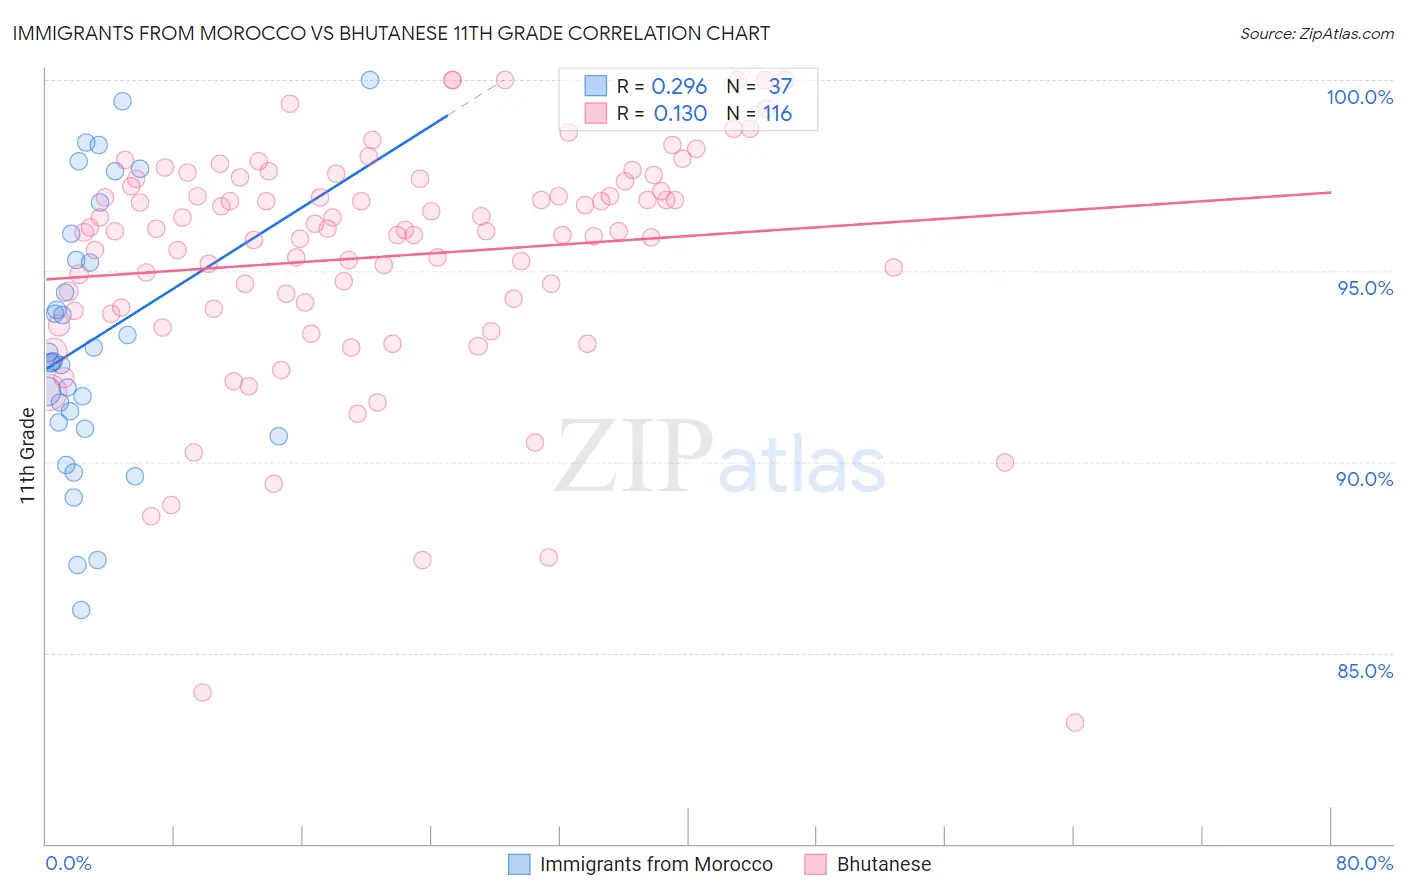
Immigrants from Morocco vs Bhutanese 11th Grade Correlation Chart
The statistical analysis conducted on geographies consisting of 178,912,438 people shows a weak positive correlation between the proportion of Immigrants from Morocco and percentage of population with at least 11th grade education in the United States with a correlation coefficient (R) of 0.296 and weighted average of 92.4%. Similarly, the statistical analysis conducted on geographies consisting of 455,591,134 people shows a poor positive correlation between the proportion of Bhutanese and percentage of population with at least 11th grade education in the United States with a correlation coefficient (R) of 0.130 and weighted average of 94.0%, a difference of 1.7%.
11th Grade Correlation Summary
| Measurement | Immigrants from Morocco | Bhutanese |
| Minimum | 86.1% | 83.2% |
| Maximum | 100.0% | 100.0% |
| Range | 13.9% | 16.8% |
| Mean | 93.2% | 95.4% |
| Median | 92.6% | 96.0% |
| Interquartile 25% (IQ1) | 91.0% | 94.0% |
| Interquartile 75% (IQ3) | 95.6% | 97.3% |
| Interquartile Range (IQR) | 4.7% | 3.3% |
| Standard Deviation (Sample) | 3.5% | 3.1% |
| Standard Deviation (Population) | 3.4% | 3.1% |
Similar Demographics by 11th Grade
Demographics Similar to Immigrants from Morocco by 11th Grade
In terms of 11th grade, the demographic groups most similar to Immigrants from Morocco are Immigrants from Malaysia (92.4%, a difference of 0.010%), Immigrants from Asia (92.4%, a difference of 0.010%), Creek (92.4%, a difference of 0.020%), Inupiat (92.4%, a difference of 0.020%), and Cherokee (92.4%, a difference of 0.020%).
| Demographics | Rating | Rank | 11th Grade |
| Shoshone | 48.9 /100 | #175 | Average 92.5% |
| Spaniards | 46.9 /100 | #176 | Average 92.5% |
| Guamanians/Chamorros | 45.0 /100 | #177 | Average 92.5% |
| Sudanese | 43.4 /100 | #178 | Average 92.5% |
| Creek | 40.9 /100 | #179 | Average 92.4% |
| Inupiat | 40.7 /100 | #180 | Average 92.4% |
| Cherokee | 40.7 /100 | #181 | Average 92.4% |
| Immigrants | Morocco | 38.6 /100 | #182 | Fair 92.4% |
| Immigrants | Malaysia | 37.6 /100 | #183 | Fair 92.4% |
| Immigrants | Asia | 37.4 /100 | #184 | Fair 92.4% |
| Immigrants | Nepal | 36.4 /100 | #185 | Fair 92.4% |
| Arapaho | 35.1 /100 | #186 | Fair 92.4% |
| Immigrants | Western Asia | 35.0 /100 | #187 | Fair 92.4% |
| Immigrants | Indonesia | 33.7 /100 | #188 | Fair 92.4% |
| Immigrants | Chile | 33.3 /100 | #189 | Fair 92.4% |
Demographics Similar to Bhutanese by 11th Grade
In terms of 11th grade, the demographic groups most similar to Bhutanese are French Canadian (94.0%, a difference of 0.0%), New Zealander (94.0%, a difference of 0.0%), Iranian (94.0%, a difference of 0.0%), Okinawan (94.0%, a difference of 0.0%), and Immigrants from North America (94.0%, a difference of 0.010%).
| Demographics | Rating | Rank | 11th Grade |
| Immigrants | Canada | 99.9 /100 | #52 | Exceptional 94.0% |
| Immigrants | Australia | 99.9 /100 | #53 | Exceptional 94.0% |
| Immigrants | North America | 99.9 /100 | #54 | Exceptional 94.0% |
| Czechoslovakians | 99.9 /100 | #55 | Exceptional 94.0% |
| French Canadians | 99.9 /100 | #56 | Exceptional 94.0% |
| New Zealanders | 99.9 /100 | #57 | Exceptional 94.0% |
| Iranians | 99.9 /100 | #58 | Exceptional 94.0% |
| Bhutanese | 99.8 /100 | #59 | Exceptional 94.0% |
| Okinawans | 99.8 /100 | #60 | Exceptional 94.0% |
| Immigrants | Belgium | 99.8 /100 | #61 | Exceptional 94.0% |
| Austrians | 99.8 /100 | #62 | Exceptional 94.0% |
| Ukrainians | 99.8 /100 | #63 | Exceptional 94.0% |
| Immigrants | Sweden | 99.8 /100 | #64 | Exceptional 93.9% |
| Native Hawaiians | 99.8 /100 | #65 | Exceptional 93.9% |
| Alaskan Athabascans | 99.8 /100 | #66 | Exceptional 93.9% |