Immigrants from Moldova vs Cheyenne 5th Grade
COMPARE
Immigrants from Moldova
Cheyenne
5th Grade
5th Grade Comparison
Immigrants from Moldova
Cheyenne
97.5%
5TH GRADE
87.5/ 100
METRIC RATING
136th/ 347
METRIC RANK
97.7%
5TH GRADE
97.9/ 100
METRIC RATING
103rd/ 347
METRIC RANK
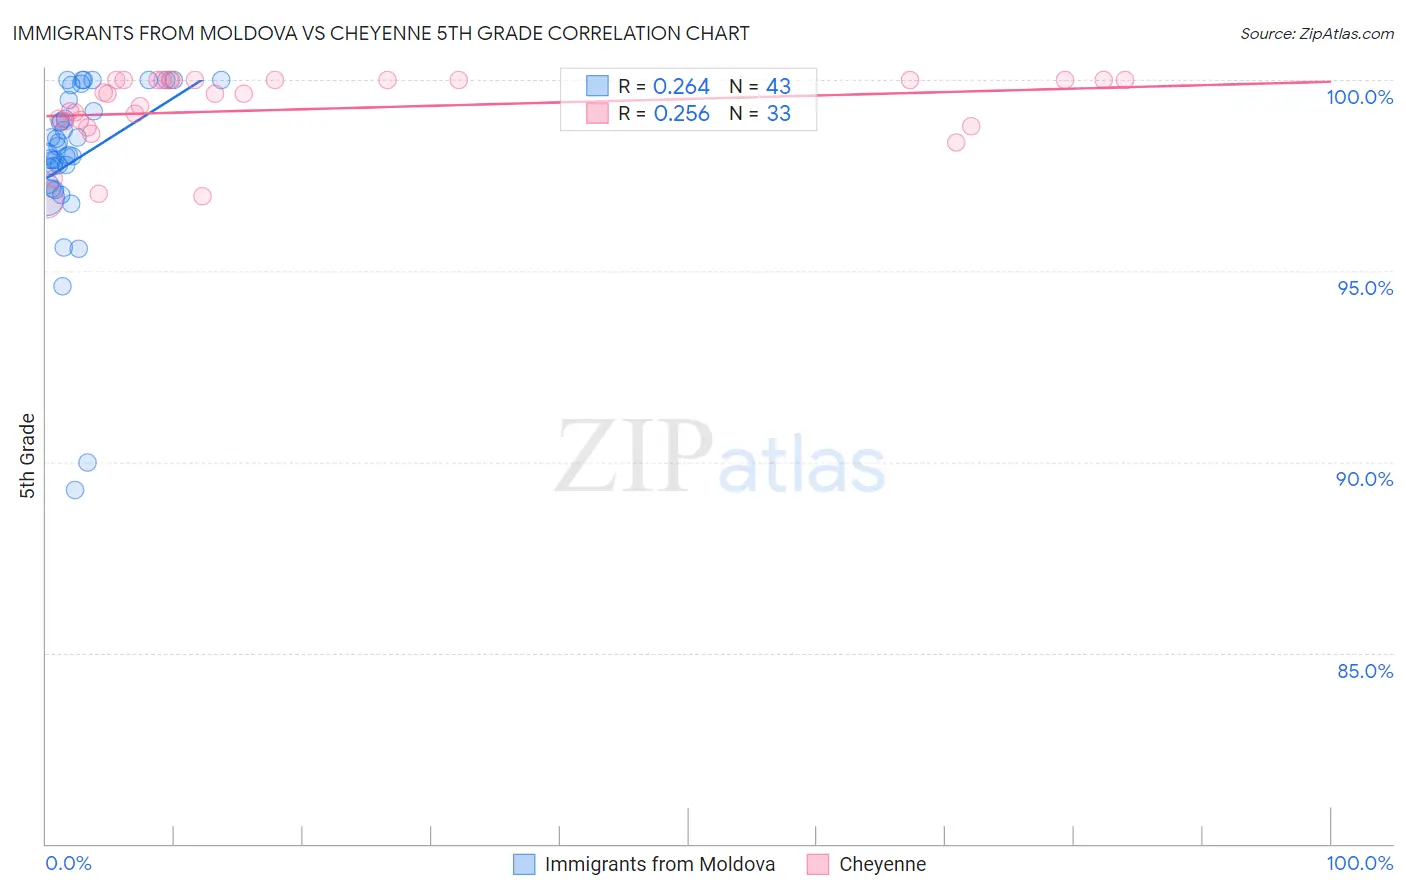
Immigrants from Moldova vs Cheyenne 5th Grade Correlation Chart
The statistical analysis conducted on geographies consisting of 124,398,501 people shows a weak positive correlation between the proportion of Immigrants from Moldova and percentage of population with at least 5th grade education in the United States with a correlation coefficient (R) of 0.264 and weighted average of 97.5%. Similarly, the statistical analysis conducted on geographies consisting of 80,716,760 people shows a weak positive correlation between the proportion of Cheyenne and percentage of population with at least 5th grade education in the United States with a correlation coefficient (R) of 0.256 and weighted average of 97.7%, a difference of 0.20%.
5th Grade Correlation Summary
| Measurement | Immigrants from Moldova | Cheyenne |
| Minimum | 89.3% | 96.8% |
| Maximum | 100.0% | 100.0% |
| Range | 10.7% | 3.2% |
| Mean | 97.9% | 99.2% |
| Median | 98.1% | 99.6% |
| Interquartile 25% (IQ1) | 97.3% | 98.8% |
| Interquartile 75% (IQ3) | 99.5% | 100.0% |
| Interquartile Range (IQR) | 2.2% | 1.2% |
| Standard Deviation (Sample) | 2.3% | 0.97% |
| Standard Deviation (Population) | 2.2% | 0.95% |
Similar Demographics by 5th Grade
Demographics Similar to Immigrants from Moldova by 5th Grade
In terms of 5th grade, the demographic groups most similar to Immigrants from Moldova are Filipino (97.5%, a difference of 0.010%), Blackfeet (97.5%, a difference of 0.010%), Immigrants from Turkey (97.5%, a difference of 0.010%), Burmese (97.5%, a difference of 0.010%), and Palestinian (97.5%, a difference of 0.020%).
| Demographics | Rating | Rank | 5th Grade |
| Immigrants | Europe | 91.9 /100 | #129 | Exceptional 97.6% |
| Immigrants | Romania | 91.6 /100 | #130 | Exceptional 97.6% |
| Pima | 91.2 /100 | #131 | Exceptional 97.6% |
| Immigrants | Kuwait | 90.4 /100 | #132 | Exceptional 97.6% |
| Cambodians | 90.2 /100 | #133 | Exceptional 97.6% |
| Immigrants | Hungary | 90.1 /100 | #134 | Exceptional 97.6% |
| Palestinians | 89.3 /100 | #135 | Excellent 97.5% |
| Immigrants | Moldova | 87.5 /100 | #136 | Excellent 97.5% |
| Filipinos | 86.8 /100 | #137 | Excellent 97.5% |
| Blackfeet | 86.8 /100 | #138 | Excellent 97.5% |
| Immigrants | Turkey | 86.7 /100 | #139 | Excellent 97.5% |
| Burmese | 86.1 /100 | #140 | Excellent 97.5% |
| Seminole | 85.8 /100 | #141 | Excellent 97.5% |
| Israelis | 85.5 /100 | #142 | Excellent 97.5% |
| Immigrants | North Macedonia | 85.4 /100 | #143 | Excellent 97.5% |
Demographics Similar to Cheyenne by 5th Grade
In terms of 5th grade, the demographic groups most similar to Cheyenne are Choctaw (97.7%, a difference of 0.0%), German Russian (97.7%, a difference of 0.010%), Yugoslavian (97.7%, a difference of 0.020%), Turkish (97.7%, a difference of 0.020%), and Puget Sound Salish (97.7%, a difference of 0.020%).
| Demographics | Rating | Rank | 5th Grade |
| Immigrants | Germany | 98.5 /100 | #96 | Exceptional 97.8% |
| Cree | 98.4 /100 | #97 | Exceptional 97.7% |
| Yugoslavians | 98.3 /100 | #98 | Exceptional 97.7% |
| Turks | 98.3 /100 | #99 | Exceptional 97.7% |
| Puget Sound Salish | 98.3 /100 | #100 | Exceptional 97.7% |
| South Africans | 98.3 /100 | #101 | Exceptional 97.7% |
| Choctaw | 98.0 /100 | #102 | Exceptional 97.7% |
| Cheyenne | 97.9 /100 | #103 | Exceptional 97.7% |
| German Russians | 97.8 /100 | #104 | Exceptional 97.7% |
| Bhutanese | 97.6 /100 | #105 | Exceptional 97.7% |
| Immigrants | Czechoslovakia | 97.5 /100 | #106 | Exceptional 97.7% |
| Immigrants | Singapore | 97.5 /100 | #107 | Exceptional 97.7% |
| Immigrants | Nonimmigrants | 97.3 /100 | #108 | Exceptional 97.7% |
| Immigrants | Latvia | 97.1 /100 | #109 | Exceptional 97.7% |
| Thais | 96.9 /100 | #110 | Exceptional 97.7% |