Immigrants from Moldova vs Afghan 5th Grade
COMPARE
Immigrants from Moldova
Afghan
5th Grade
5th Grade Comparison
Immigrants from Moldova
Afghans
97.5%
5TH GRADE
87.5/ 100
METRIC RATING
136th/ 347
METRIC RANK
96.7%
5TH GRADE
0.2/ 100
METRIC RATING
270th/ 347
METRIC RANK
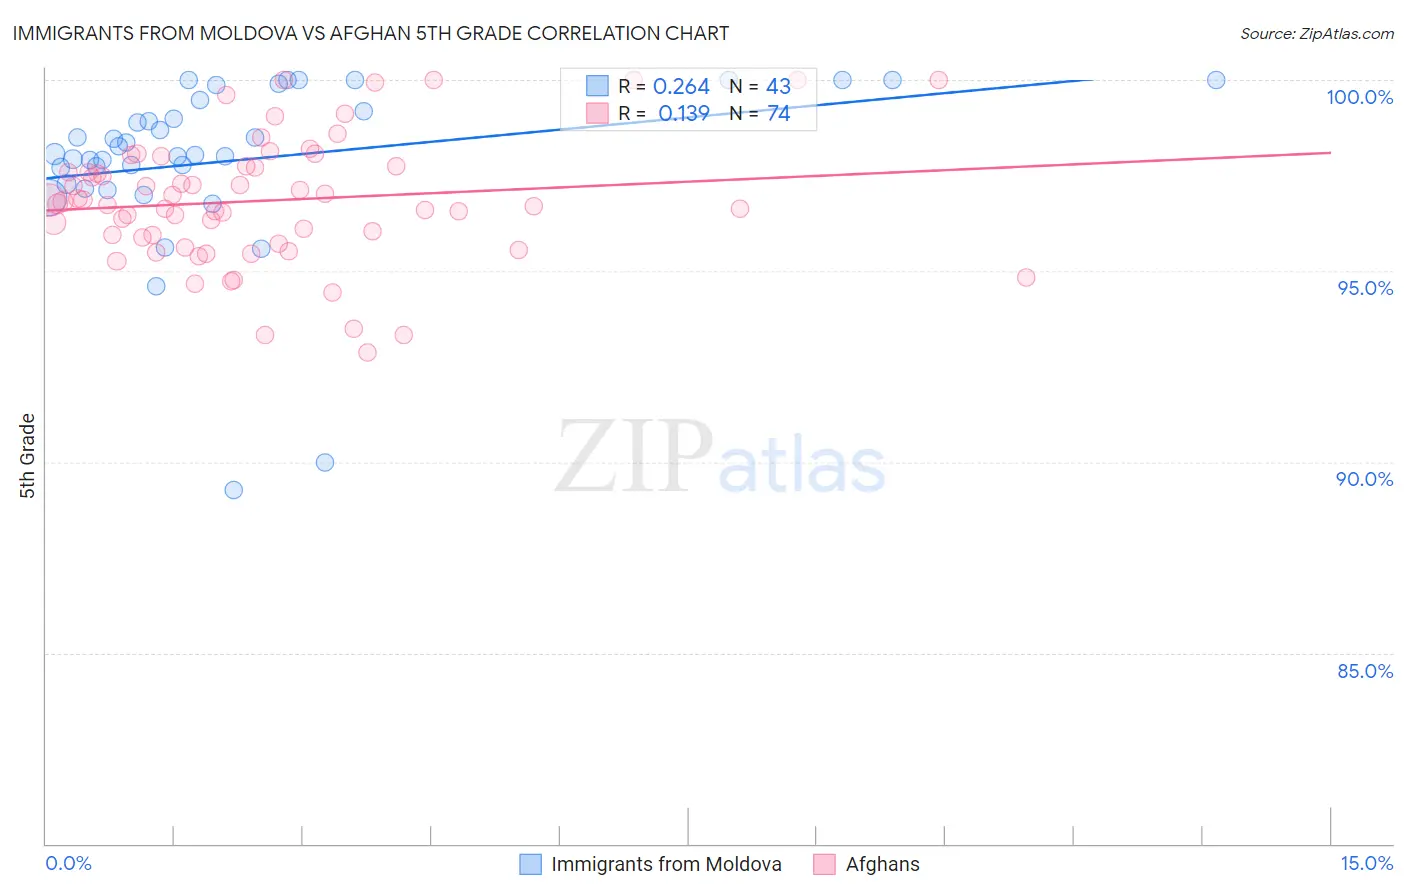
Immigrants from Moldova vs Afghan 5th Grade Correlation Chart
The statistical analysis conducted on geographies consisting of 124,398,501 people shows a weak positive correlation between the proportion of Immigrants from Moldova and percentage of population with at least 5th grade education in the United States with a correlation coefficient (R) of 0.264 and weighted average of 97.5%. Similarly, the statistical analysis conducted on geographies consisting of 148,851,685 people shows a poor positive correlation between the proportion of Afghans and percentage of population with at least 5th grade education in the United States with a correlation coefficient (R) of 0.139 and weighted average of 96.7%, a difference of 0.88%.
5th Grade Correlation Summary
| Measurement | Immigrants from Moldova | Afghan |
| Minimum | 89.3% | 92.9% |
| Maximum | 100.0% | 100.0% |
| Range | 10.7% | 7.1% |
| Mean | 97.9% | 96.8% |
| Median | 98.1% | 96.8% |
| Interquartile 25% (IQ1) | 97.3% | 95.9% |
| Interquartile 75% (IQ3) | 99.5% | 97.7% |
| Interquartile Range (IQR) | 2.2% | 1.9% |
| Standard Deviation (Sample) | 2.3% | 1.6% |
| Standard Deviation (Population) | 2.2% | 1.6% |
Similar Demographics by 5th Grade
Demographics Similar to Immigrants from Moldova by 5th Grade
In terms of 5th grade, the demographic groups most similar to Immigrants from Moldova are Filipino (97.5%, a difference of 0.010%), Blackfeet (97.5%, a difference of 0.010%), Immigrants from Turkey (97.5%, a difference of 0.010%), Burmese (97.5%, a difference of 0.010%), and Palestinian (97.5%, a difference of 0.020%).
| Demographics | Rating | Rank | 5th Grade |
| Immigrants | Europe | 91.9 /100 | #129 | Exceptional 97.6% |
| Immigrants | Romania | 91.6 /100 | #130 | Exceptional 97.6% |
| Pima | 91.2 /100 | #131 | Exceptional 97.6% |
| Immigrants | Kuwait | 90.4 /100 | #132 | Exceptional 97.6% |
| Cambodians | 90.2 /100 | #133 | Exceptional 97.6% |
| Immigrants | Hungary | 90.1 /100 | #134 | Exceptional 97.6% |
| Palestinians | 89.3 /100 | #135 | Excellent 97.5% |
| Immigrants | Moldova | 87.5 /100 | #136 | Excellent 97.5% |
| Filipinos | 86.8 /100 | #137 | Excellent 97.5% |
| Blackfeet | 86.8 /100 | #138 | Excellent 97.5% |
| Immigrants | Turkey | 86.7 /100 | #139 | Excellent 97.5% |
| Burmese | 86.1 /100 | #140 | Excellent 97.5% |
| Seminole | 85.8 /100 | #141 | Excellent 97.5% |
| Israelis | 85.5 /100 | #142 | Excellent 97.5% |
| Immigrants | North Macedonia | 85.4 /100 | #143 | Excellent 97.5% |
Demographics Similar to Afghans by 5th Grade
In terms of 5th grade, the demographic groups most similar to Afghans are Immigrants from Hong Kong (96.7%, a difference of 0.0%), Trinidadian and Tobagonian (96.7%, a difference of 0.020%), Yaqui (96.7%, a difference of 0.020%), Immigrants from Cameroon (96.7%, a difference of 0.020%), and Immigrants from Peru (96.6%, a difference of 0.030%).
| Demographics | Rating | Rank | 5th Grade |
| Immigrants | Uzbekistan | 0.3 /100 | #263 | Tragic 96.8% |
| West Indians | 0.3 /100 | #264 | Tragic 96.8% |
| Taiwanese | 0.3 /100 | #265 | Tragic 96.7% |
| Immigrants | Nigeria | 0.3 /100 | #266 | Tragic 96.7% |
| Immigrants | South America | 0.3 /100 | #267 | Tragic 96.7% |
| Armenians | 0.3 /100 | #268 | Tragic 96.7% |
| Ghanaians | 0.2 /100 | #269 | Tragic 96.7% |
| Afghans | 0.2 /100 | #270 | Tragic 96.7% |
| Immigrants | Hong Kong | 0.2 /100 | #271 | Tragic 96.7% |
| Trinidadians and Tobagonians | 0.1 /100 | #272 | Tragic 96.7% |
| Yaqui | 0.1 /100 | #273 | Tragic 96.7% |
| Immigrants | Cameroon | 0.1 /100 | #274 | Tragic 96.7% |
| Immigrants | Peru | 0.1 /100 | #275 | Tragic 96.6% |
| Cubans | 0.1 /100 | #276 | Tragic 96.6% |
| Immigrants | Bolivia | 0.1 /100 | #277 | Tragic 96.6% |