Immigrants from Middle Africa vs Immigrants from Bangladesh Kindergarten
COMPARE
Immigrants from Middle Africa
Immigrants from Bangladesh
Kindergarten
Kindergarten Comparison
Immigrants from Middle Africa
Immigrants from Bangladesh
97.6%
KINDERGARTEN
1.0/ 100
METRIC RATING
248th/ 347
METRIC RANK
96.8%
KINDERGARTEN
0.0/ 100
METRIC RATING
321st/ 347
METRIC RANK
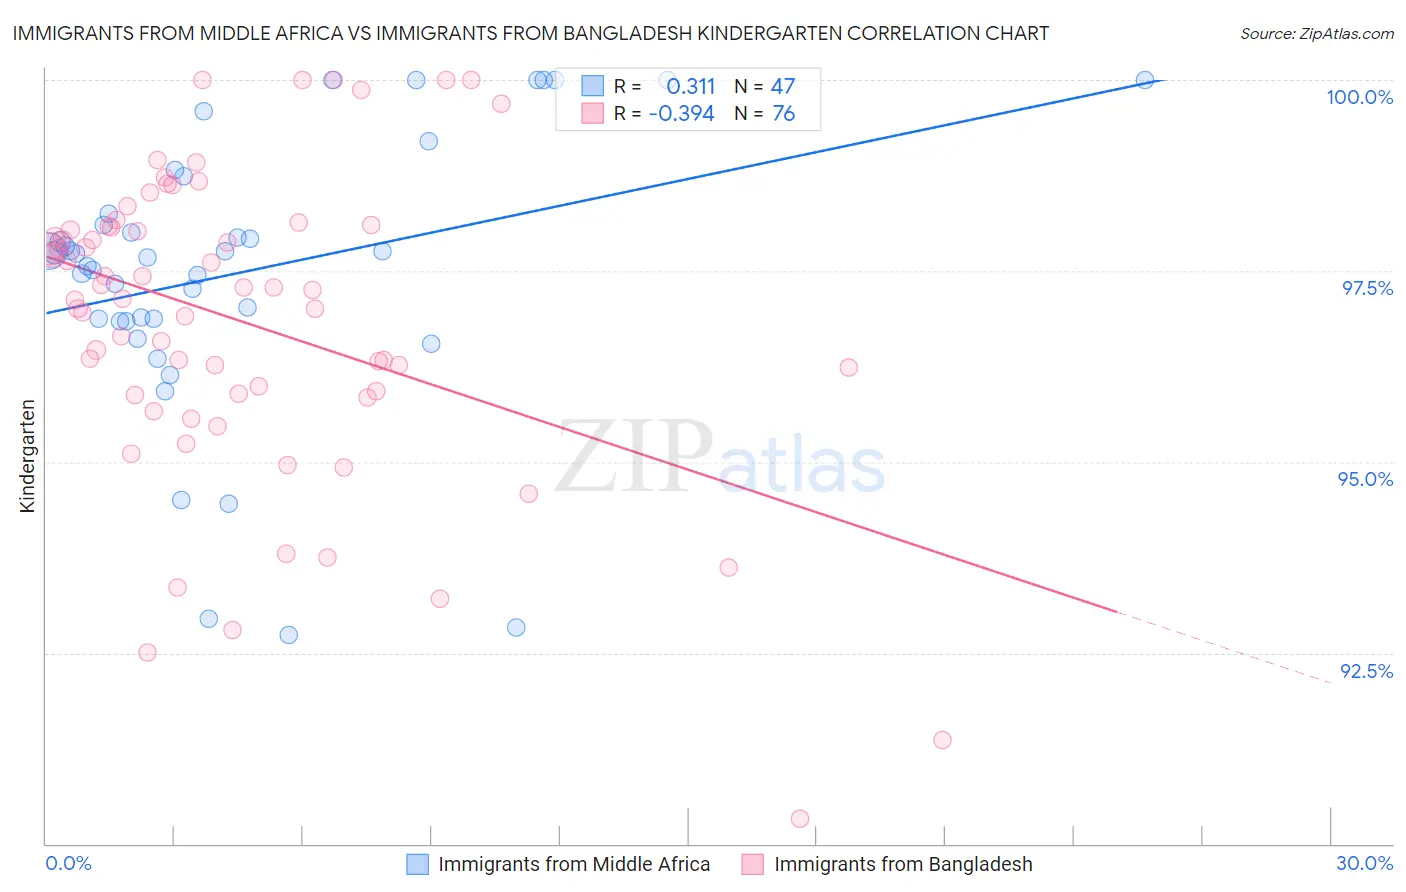
Immigrants from Middle Africa vs Immigrants from Bangladesh Kindergarten Correlation Chart
The statistical analysis conducted on geographies consisting of 202,721,852 people shows a mild positive correlation between the proportion of Immigrants from Middle Africa and percentage of population with at least kindergarten education in the United States with a correlation coefficient (R) of 0.311 and weighted average of 97.6%. Similarly, the statistical analysis conducted on geographies consisting of 203,681,254 people shows a mild negative correlation between the proportion of Immigrants from Bangladesh and percentage of population with at least kindergarten education in the United States with a correlation coefficient (R) of -0.394 and weighted average of 96.8%, a difference of 0.80%.
Kindergarten Correlation Summary
| Measurement | Immigrants from Middle Africa | Immigrants from Bangladesh |
| Minimum | 92.7% | 90.3% |
| Maximum | 100.0% | 100.0% |
| Range | 7.3% | 9.7% |
| Mean | 97.5% | 96.8% |
| Median | 97.7% | 97.2% |
| Interquartile 25% (IQ1) | 96.8% | 95.9% |
| Interquartile 75% (IQ3) | 98.2% | 98.1% |
| Interquartile Range (IQR) | 1.4% | 2.2% |
| Standard Deviation (Sample) | 1.8% | 2.0% |
| Standard Deviation (Population) | 1.8% | 2.0% |
Similar Demographics by Kindergarten
Demographics Similar to Immigrants from Middle Africa by Kindergarten
In terms of kindergarten, the demographic groups most similar to Immigrants from Middle Africa are South American (97.6%, a difference of 0.0%), Indian (Asian) (97.6%, a difference of 0.0%), Immigrants from Eastern Africa (97.6%, a difference of 0.0%), Peruvian (97.6%, a difference of 0.0%), and Asian (97.6%, a difference of 0.010%).
| Demographics | Rating | Rank | Kindergarten |
| Liberians | 1.3 /100 | #241 | Tragic 97.6% |
| Immigrants | Indonesia | 1.3 /100 | #242 | Tragic 97.6% |
| Asians | 1.2 /100 | #243 | Tragic 97.6% |
| Bolivians | 1.2 /100 | #244 | Tragic 97.6% |
| South Americans | 1.1 /100 | #245 | Tragic 97.6% |
| Indians (Asian) | 1.0 /100 | #246 | Tragic 97.6% |
| Immigrants | Eastern Africa | 1.0 /100 | #247 | Tragic 97.6% |
| Immigrants | Middle Africa | 1.0 /100 | #248 | Tragic 97.6% |
| Peruvians | 1.0 /100 | #249 | Tragic 97.6% |
| Immigrants | Senegal | 0.9 /100 | #250 | Tragic 97.6% |
| Ethiopians | 0.9 /100 | #251 | Tragic 97.6% |
| Immigrants | Iraq | 0.9 /100 | #252 | Tragic 97.6% |
| Immigrants | Africa | 0.8 /100 | #253 | Tragic 97.6% |
| Immigrants | Asia | 0.8 /100 | #254 | Tragic 97.6% |
| Immigrants | Congo | 0.8 /100 | #255 | Tragic 97.6% |
Demographics Similar to Immigrants from Bangladesh by Kindergarten
In terms of kindergarten, the demographic groups most similar to Immigrants from Bangladesh are Immigrants from Guyana (96.8%, a difference of 0.010%), Immigrants from Burma/Myanmar (96.8%, a difference of 0.010%), Mexican American Indian (96.8%, a difference of 0.010%), Immigrants from Laos (96.9%, a difference of 0.020%), and Immigrants from Honduras (96.8%, a difference of 0.020%).
| Demographics | Rating | Rank | Kindergarten |
| Hondurans | 0.0 /100 | #314 | Tragic 96.9% |
| Immigrants | Belize | 0.0 /100 | #315 | Tragic 96.9% |
| Immigrants | Nicaragua | 0.0 /100 | #316 | Tragic 96.9% |
| Immigrants | Ecuador | 0.0 /100 | #317 | Tragic 96.9% |
| Immigrants | Laos | 0.0 /100 | #318 | Tragic 96.9% |
| Immigrants | Guyana | 0.0 /100 | #319 | Tragic 96.8% |
| Immigrants | Burma/Myanmar | 0.0 /100 | #320 | Tragic 96.8% |
| Immigrants | Bangladesh | 0.0 /100 | #321 | Tragic 96.8% |
| Mexican American Indians | 0.0 /100 | #322 | Tragic 96.8% |
| Immigrants | Honduras | 0.0 /100 | #323 | Tragic 96.8% |
| Vietnamese | 0.0 /100 | #324 | Tragic 96.8% |
| Indonesians | 0.0 /100 | #325 | Tragic 96.8% |
| Dominicans | 0.0 /100 | #326 | Tragic 96.8% |
| Mexicans | 0.0 /100 | #327 | Tragic 96.7% |
| Immigrants | Latin America | 0.0 /100 | #328 | Tragic 96.7% |