Argentinean vs Immigrants from Bangladesh Kindergarten
COMPARE
Argentinean
Immigrants from Bangladesh
Kindergarten
Kindergarten Comparison
Argentineans
Immigrants from Bangladesh
97.9%
KINDERGARTEN
46.8/ 100
METRIC RATING
179th/ 347
METRIC RANK
96.8%
KINDERGARTEN
0.0/ 100
METRIC RATING
321st/ 347
METRIC RANK
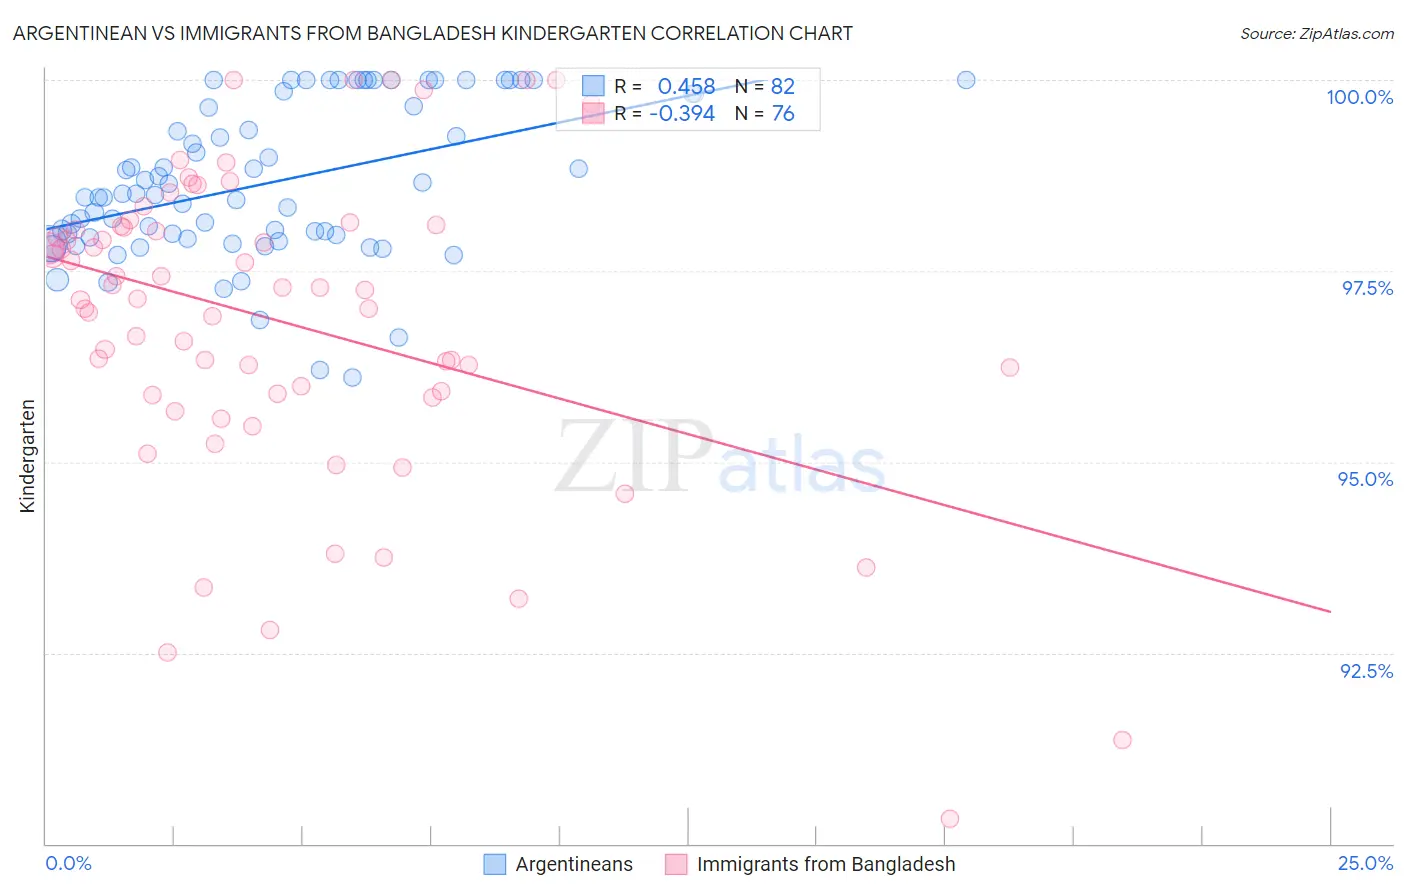
Argentinean vs Immigrants from Bangladesh Kindergarten Correlation Chart
The statistical analysis conducted on geographies consisting of 297,146,811 people shows a moderate positive correlation between the proportion of Argentineans and percentage of population with at least kindergarten education in the United States with a correlation coefficient (R) of 0.458 and weighted average of 97.9%. Similarly, the statistical analysis conducted on geographies consisting of 203,681,254 people shows a mild negative correlation between the proportion of Immigrants from Bangladesh and percentage of population with at least kindergarten education in the United States with a correlation coefficient (R) of -0.394 and weighted average of 96.8%, a difference of 1.1%.
Kindergarten Correlation Summary
| Measurement | Argentinean | Immigrants from Bangladesh |
| Minimum | 96.1% | 90.3% |
| Maximum | 100.0% | 100.0% |
| Range | 3.9% | 9.7% |
| Mean | 98.7% | 96.8% |
| Median | 98.5% | 97.2% |
| Interquartile 25% (IQ1) | 97.9% | 95.9% |
| Interquartile 75% (IQ3) | 99.8% | 98.1% |
| Interquartile Range (IQR) | 1.9% | 2.2% |
| Standard Deviation (Sample) | 1.0% | 2.0% |
| Standard Deviation (Population) | 1.00% | 2.0% |
Similar Demographics by Kindergarten
Demographics Similar to Argentineans by Kindergarten
In terms of kindergarten, the demographic groups most similar to Argentineans are Immigrants from Venezuela (97.9%, a difference of 0.0%), Brazilian (97.9%, a difference of 0.0%), Immigrants from Bosnia and Herzegovina (97.9%, a difference of 0.0%), Native/Alaskan (98.0%, a difference of 0.010%), and Kenyan (98.0%, a difference of 0.010%).
| Demographics | Rating | Rank | Kindergarten |
| Natives/Alaskans | 51.0 /100 | #172 | Average 98.0% |
| Kenyans | 51.0 /100 | #173 | Average 98.0% |
| Immigrants | Brazil | 50.0 /100 | #174 | Average 98.0% |
| Immigrants | Sri Lanka | 49.6 /100 | #175 | Average 97.9% |
| Albanians | 48.5 /100 | #176 | Average 97.9% |
| Immigrants | Venezuela | 47.9 /100 | #177 | Average 97.9% |
| Brazilians | 47.6 /100 | #178 | Average 97.9% |
| Argentineans | 46.8 /100 | #179 | Average 97.9% |
| Immigrants | Bosnia and Herzegovina | 46.7 /100 | #180 | Average 97.9% |
| Portuguese | 43.5 /100 | #181 | Average 97.9% |
| Egyptians | 42.4 /100 | #182 | Average 97.9% |
| Immigrants | Poland | 41.4 /100 | #183 | Average 97.9% |
| Immigrants | Argentina | 40.7 /100 | #184 | Average 97.9% |
| Immigrants | Belarus | 39.4 /100 | #185 | Fair 97.9% |
| Pakistanis | 36.0 /100 | #186 | Fair 97.9% |
Demographics Similar to Immigrants from Bangladesh by Kindergarten
In terms of kindergarten, the demographic groups most similar to Immigrants from Bangladesh are Immigrants from Guyana (96.8%, a difference of 0.010%), Immigrants from Burma/Myanmar (96.8%, a difference of 0.010%), Mexican American Indian (96.8%, a difference of 0.010%), Immigrants from Laos (96.9%, a difference of 0.020%), and Immigrants from Honduras (96.8%, a difference of 0.020%).
| Demographics | Rating | Rank | Kindergarten |
| Hondurans | 0.0 /100 | #314 | Tragic 96.9% |
| Immigrants | Belize | 0.0 /100 | #315 | Tragic 96.9% |
| Immigrants | Nicaragua | 0.0 /100 | #316 | Tragic 96.9% |
| Immigrants | Ecuador | 0.0 /100 | #317 | Tragic 96.9% |
| Immigrants | Laos | 0.0 /100 | #318 | Tragic 96.9% |
| Immigrants | Guyana | 0.0 /100 | #319 | Tragic 96.8% |
| Immigrants | Burma/Myanmar | 0.0 /100 | #320 | Tragic 96.8% |
| Immigrants | Bangladesh | 0.0 /100 | #321 | Tragic 96.8% |
| Mexican American Indians | 0.0 /100 | #322 | Tragic 96.8% |
| Immigrants | Honduras | 0.0 /100 | #323 | Tragic 96.8% |
| Vietnamese | 0.0 /100 | #324 | Tragic 96.8% |
| Indonesians | 0.0 /100 | #325 | Tragic 96.8% |
| Dominicans | 0.0 /100 | #326 | Tragic 96.8% |
| Mexicans | 0.0 /100 | #327 | Tragic 96.7% |
| Immigrants | Latin America | 0.0 /100 | #328 | Tragic 96.7% |