Immigrants from Micronesia vs Russian 6th Grade
COMPARE
Immigrants from Micronesia
Russian
6th Grade
6th Grade Comparison
Immigrants from Micronesia
Russians
97.0%
6TH GRADE
47.1/ 100
METRIC RATING
176th/ 347
METRIC RANK
97.7%
6TH GRADE
99.7/ 100
METRIC RATING
63rd/ 347
METRIC RANK
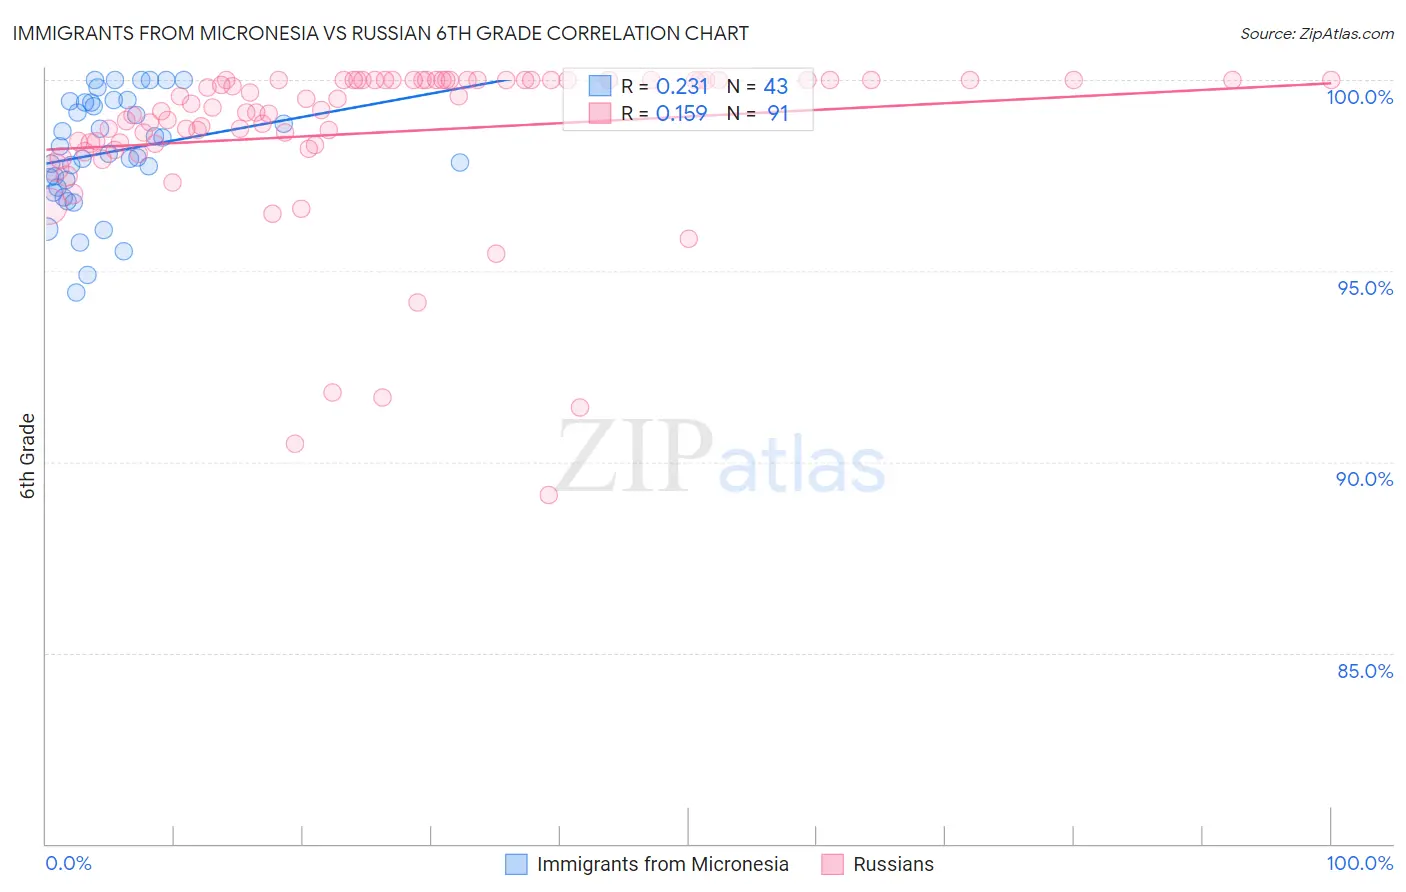
Immigrants from Micronesia vs Russian 6th Grade Correlation Chart
The statistical analysis conducted on geographies consisting of 61,604,657 people shows a weak positive correlation between the proportion of Immigrants from Micronesia and percentage of population with at least 6th grade education in the United States with a correlation coefficient (R) of 0.231 and weighted average of 97.0%. Similarly, the statistical analysis conducted on geographies consisting of 512,259,047 people shows a poor positive correlation between the proportion of Russians and percentage of population with at least 6th grade education in the United States with a correlation coefficient (R) of 0.159 and weighted average of 97.7%, a difference of 0.67%.
6th Grade Correlation Summary
| Measurement | Immigrants from Micronesia | Russian |
| Minimum | 94.4% | 89.1% |
| Maximum | 100.0% | 100.0% |
| Range | 5.6% | 10.9% |
| Mean | 98.1% | 98.6% |
| Median | 98.1% | 99.3% |
| Interquartile 25% (IQ1) | 97.2% | 98.3% |
| Interquartile 75% (IQ3) | 99.4% | 100.0% |
| Interquartile Range (IQR) | 2.2% | 1.7% |
| Standard Deviation (Sample) | 1.5% | 2.2% |
| Standard Deviation (Population) | 1.5% | 2.2% |
Similar Demographics by 6th Grade
Demographics Similar to Immigrants from Micronesia by 6th Grade
In terms of 6th grade, the demographic groups most similar to Immigrants from Micronesia are Immigrants from Kazakhstan (97.0%, a difference of 0.0%), Mongolian (97.0%, a difference of 0.0%), Arab (97.0%, a difference of 0.010%), Venezuelan (97.0%, a difference of 0.010%), and Pakistani (97.0%, a difference of 0.010%).
| Demographics | Rating | Rank | 6th Grade |
| Bermudans | 52.6 /100 | #169 | Average 97.1% |
| Chileans | 52.1 /100 | #170 | Average 97.1% |
| Immigrants | Sri Lanka | 51.7 /100 | #171 | Average 97.1% |
| Egyptians | 50.9 /100 | #172 | Average 97.1% |
| Arabs | 50.1 /100 | #173 | Average 97.0% |
| Venezuelans | 50.0 /100 | #174 | Average 97.0% |
| Immigrants | Kazakhstan | 47.3 /100 | #175 | Average 97.0% |
| Immigrants | Micronesia | 47.1 /100 | #176 | Average 97.0% |
| Mongolians | 46.7 /100 | #177 | Average 97.0% |
| Pakistanis | 46.0 /100 | #178 | Average 97.0% |
| Immigrants | Kenya | 45.3 /100 | #179 | Average 97.0% |
| Immigrants | Spain | 39.9 /100 | #180 | Fair 97.0% |
| Comanche | 37.9 /100 | #181 | Fair 97.0% |
| Immigrants | Ukraine | 35.6 /100 | #182 | Fair 97.0% |
| Immigrants | Venezuela | 34.5 /100 | #183 | Fair 97.0% |
Demographics Similar to Russians by 6th Grade
In terms of 6th grade, the demographic groups most similar to Russians are Immigrants from North America (97.7%, a difference of 0.010%), Canadian (97.7%, a difference of 0.010%), Immigrants from Canada (97.7%, a difference of 0.020%), Serbian (97.7%, a difference of 0.020%), and Immigrants from Northern Europe (97.7%, a difference of 0.020%).
| Demographics | Rating | Rank | 6th Grade |
| Austrians | 99.8 /100 | #56 | Exceptional 97.7% |
| Whites/Caucasians | 99.8 /100 | #57 | Exceptional 97.7% |
| Greeks | 99.8 /100 | #58 | Exceptional 97.7% |
| Americans | 99.8 /100 | #59 | Exceptional 97.7% |
| Immigrants | Canada | 99.8 /100 | #60 | Exceptional 97.7% |
| Serbians | 99.7 /100 | #61 | Exceptional 97.7% |
| Immigrants | North America | 99.7 /100 | #62 | Exceptional 97.7% |
| Russians | 99.7 /100 | #63 | Exceptional 97.7% |
| Canadians | 99.7 /100 | #64 | Exceptional 97.7% |
| Immigrants | Northern Europe | 99.6 /100 | #65 | Exceptional 97.7% |
| New Zealanders | 99.6 /100 | #66 | Exceptional 97.7% |
| Kiowa | 99.6 /100 | #67 | Exceptional 97.7% |
| Immigrants | Austria | 99.6 /100 | #68 | Exceptional 97.7% |
| Iranians | 99.6 /100 | #69 | Exceptional 97.6% |
| Cajuns | 99.5 /100 | #70 | Exceptional 97.6% |