Immigrants from Micronesia vs Navajo 6th Grade
COMPARE
Immigrants from Micronesia
Navajo
6th Grade
6th Grade Comparison
Immigrants from Micronesia
Navajo
97.0%
6TH GRADE
47.1/ 100
METRIC RATING
176th/ 347
METRIC RANK
96.8%
6TH GRADE
7.3/ 100
METRIC RATING
218th/ 347
METRIC RANK
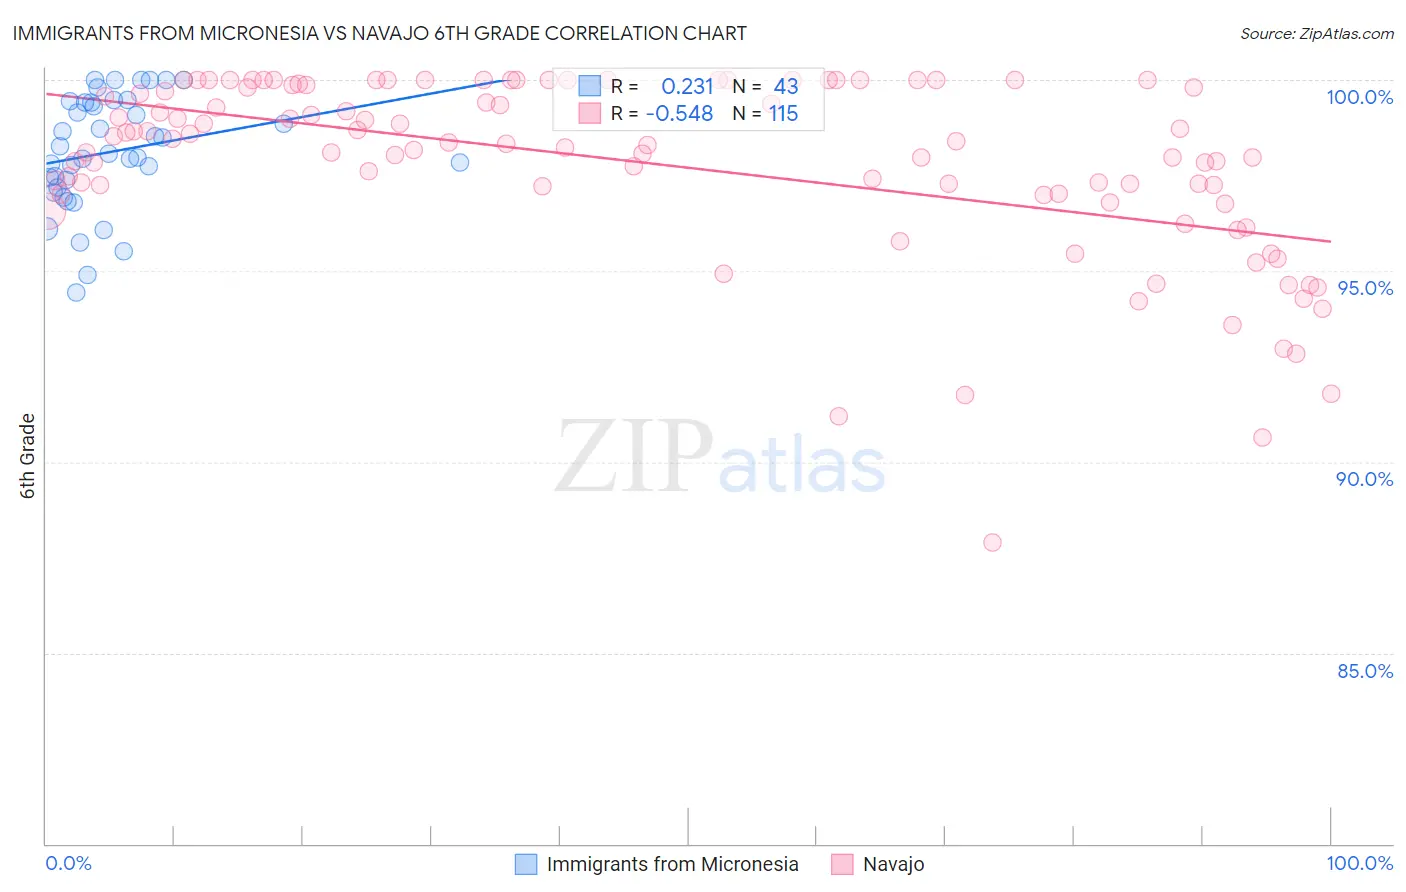
Immigrants from Micronesia vs Navajo 6th Grade Correlation Chart
The statistical analysis conducted on geographies consisting of 61,604,657 people shows a weak positive correlation between the proportion of Immigrants from Micronesia and percentage of population with at least 6th grade education in the United States with a correlation coefficient (R) of 0.231 and weighted average of 97.0%. Similarly, the statistical analysis conducted on geographies consisting of 224,872,927 people shows a substantial negative correlation between the proportion of Navajo and percentage of population with at least 6th grade education in the United States with a correlation coefficient (R) of -0.548 and weighted average of 96.8%, a difference of 0.28%.
6th Grade Correlation Summary
| Measurement | Immigrants from Micronesia | Navajo |
| Minimum | 94.4% | 87.9% |
| Maximum | 100.0% | 100.0% |
| Range | 5.6% | 12.1% |
| Mean | 98.1% | 97.8% |
| Median | 98.1% | 98.3% |
| Interquartile 25% (IQ1) | 97.2% | 97.0% |
| Interquartile 75% (IQ3) | 99.4% | 99.9% |
| Interquartile Range (IQR) | 2.2% | 2.9% |
| Standard Deviation (Sample) | 1.5% | 2.4% |
| Standard Deviation (Population) | 1.5% | 2.4% |
Similar Demographics by 6th Grade
Demographics Similar to Immigrants from Micronesia by 6th Grade
In terms of 6th grade, the demographic groups most similar to Immigrants from Micronesia are Immigrants from Kazakhstan (97.0%, a difference of 0.0%), Mongolian (97.0%, a difference of 0.0%), Arab (97.0%, a difference of 0.010%), Venezuelan (97.0%, a difference of 0.010%), and Pakistani (97.0%, a difference of 0.010%).
| Demographics | Rating | Rank | 6th Grade |
| Bermudans | 52.6 /100 | #169 | Average 97.1% |
| Chileans | 52.1 /100 | #170 | Average 97.1% |
| Immigrants | Sri Lanka | 51.7 /100 | #171 | Average 97.1% |
| Egyptians | 50.9 /100 | #172 | Average 97.1% |
| Arabs | 50.1 /100 | #173 | Average 97.0% |
| Venezuelans | 50.0 /100 | #174 | Average 97.0% |
| Immigrants | Kazakhstan | 47.3 /100 | #175 | Average 97.0% |
| Immigrants | Micronesia | 47.1 /100 | #176 | Average 97.0% |
| Mongolians | 46.7 /100 | #177 | Average 97.0% |
| Pakistanis | 46.0 /100 | #178 | Average 97.0% |
| Immigrants | Kenya | 45.3 /100 | #179 | Average 97.0% |
| Immigrants | Spain | 39.9 /100 | #180 | Fair 97.0% |
| Comanche | 37.9 /100 | #181 | Fair 97.0% |
| Immigrants | Ukraine | 35.6 /100 | #182 | Fair 97.0% |
| Immigrants | Venezuela | 34.5 /100 | #183 | Fair 97.0% |
Demographics Similar to Navajo by 6th Grade
In terms of 6th grade, the demographic groups most similar to Navajo are Liberian (96.8%, a difference of 0.0%), Sierra Leonean (96.8%, a difference of 0.010%), Paiute (96.8%, a difference of 0.010%), Costa Rican (96.8%, a difference of 0.010%), and Immigrants from Sudan (96.8%, a difference of 0.020%).
| Demographics | Rating | Rank | 6th Grade |
| Immigrants | Iraq | 9.2 /100 | #211 | Tragic 96.8% |
| Moroccans | 9.0 /100 | #212 | Tragic 96.8% |
| Immigrants | Sudan | 8.7 /100 | #213 | Tragic 96.8% |
| Portuguese | 8.2 /100 | #214 | Tragic 96.8% |
| Sierra Leoneans | 8.0 /100 | #215 | Tragic 96.8% |
| Paiute | 7.8 /100 | #216 | Tragic 96.8% |
| Liberians | 7.5 /100 | #217 | Tragic 96.8% |
| Navajo | 7.3 /100 | #218 | Tragic 96.8% |
| Costa Ricans | 6.8 /100 | #219 | Tragic 96.8% |
| Immigrants | Morocco | 6.2 /100 | #220 | Tragic 96.7% |
| Tongans | 6.1 /100 | #221 | Tragic 96.7% |
| Immigrants | Syria | 5.9 /100 | #222 | Tragic 96.7% |
| Bahamians | 4.8 /100 | #223 | Tragic 96.7% |
| Immigrants | Southern Europe | 4.4 /100 | #224 | Tragic 96.7% |
| Immigrants | Pakistan | 4.4 /100 | #225 | Tragic 96.7% |