Immigrants from Lebanon vs Immigrants from Afghanistan 3rd Grade
COMPARE
Immigrants from Lebanon
Immigrants from Afghanistan
3rd Grade
3rd Grade Comparison
Immigrants from Lebanon
Immigrants from Afghanistan
97.7%
3RD GRADE
21.7/ 100
METRIC RATING
201st/ 347
METRIC RANK
97.0%
3RD GRADE
0.0/ 100
METRIC RATING
291st/ 347
METRIC RANK
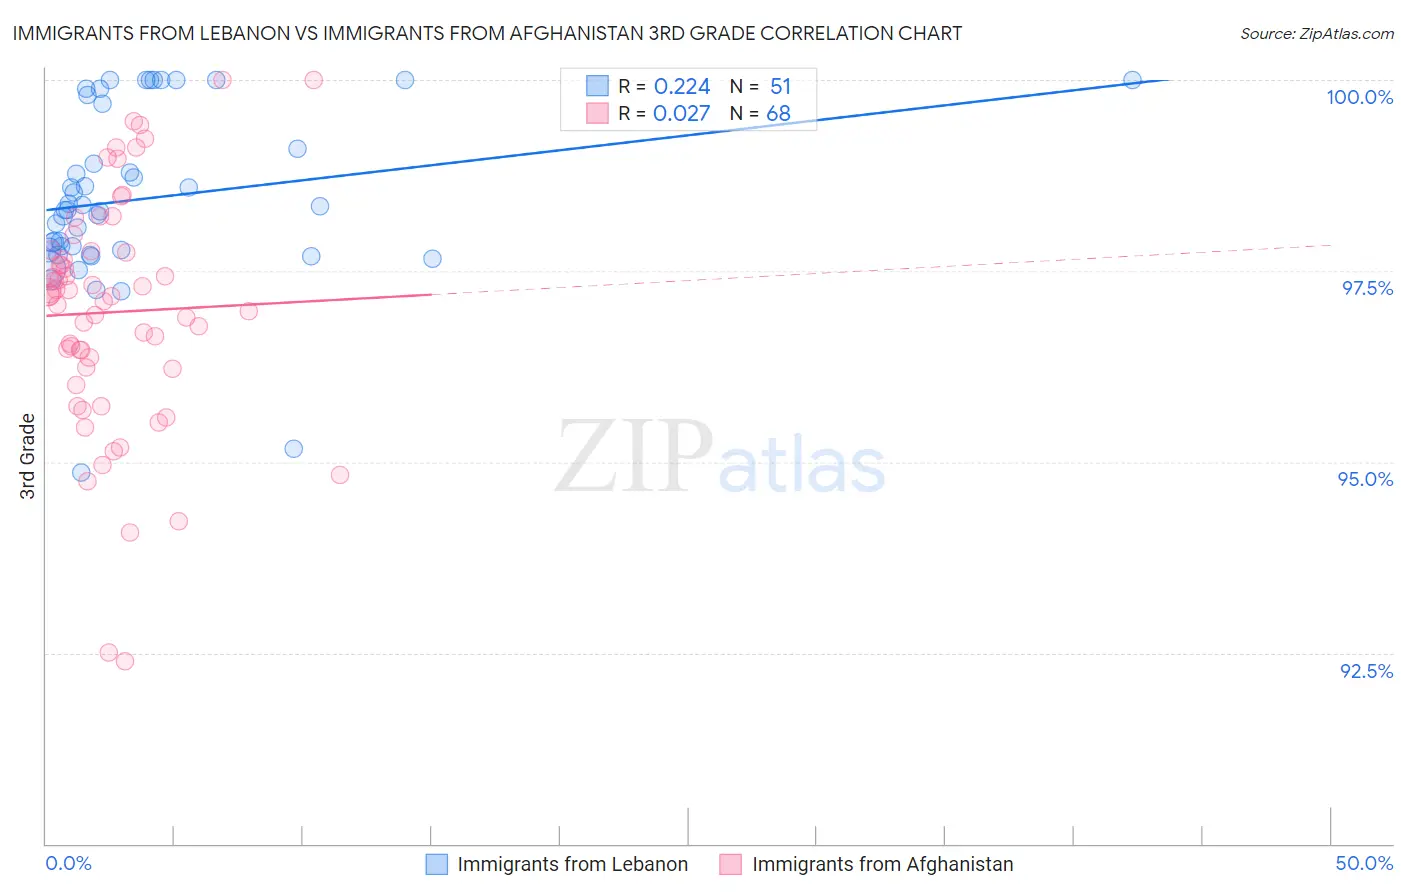
Immigrants from Lebanon vs Immigrants from Afghanistan 3rd Grade Correlation Chart
The statistical analysis conducted on geographies consisting of 217,102,284 people shows a weak positive correlation between the proportion of Immigrants from Lebanon and percentage of population with at least 3rd grade education in the United States with a correlation coefficient (R) of 0.224 and weighted average of 97.7%. Similarly, the statistical analysis conducted on geographies consisting of 147,629,924 people shows no correlation between the proportion of Immigrants from Afghanistan and percentage of population with at least 3rd grade education in the United States with a correlation coefficient (R) of 0.027 and weighted average of 97.0%, a difference of 0.63%.
3rd Grade Correlation Summary
| Measurement | Immigrants from Lebanon | Immigrants from Afghanistan |
| Minimum | 94.9% | 92.4% |
| Maximum | 100.0% | 100.0% |
| Range | 5.1% | 7.6% |
| Mean | 98.4% | 97.0% |
| Median | 98.3% | 97.2% |
| Interquartile 25% (IQ1) | 97.8% | 96.2% |
| Interquartile 75% (IQ3) | 99.7% | 97.7% |
| Interquartile Range (IQR) | 1.9% | 1.5% |
| Standard Deviation (Sample) | 1.1% | 1.5% |
| Standard Deviation (Population) | 1.1% | 1.5% |
Similar Demographics by 3rd Grade
Demographics Similar to Immigrants from Lebanon by 3rd Grade
In terms of 3rd grade, the demographic groups most similar to Immigrants from Lebanon are Immigrants from Albania (97.7%, a difference of 0.0%), Guamanian/Chamorro (97.7%, a difference of 0.010%), Immigrants from Ukraine (97.7%, a difference of 0.010%), Immigrants from Egypt (97.7%, a difference of 0.020%), and Paraguayan (97.7%, a difference of 0.020%).
| Demographics | Rating | Rank | 3rd Grade |
| Immigrants | Uganda | 27.4 /100 | #194 | Fair 97.7% |
| Immigrants | Egypt | 26.8 /100 | #195 | Fair 97.7% |
| Paraguayans | 26.2 /100 | #196 | Fair 97.7% |
| Hawaiians | 25.7 /100 | #197 | Fair 97.7% |
| Guamanians/Chamorros | 23.6 /100 | #198 | Fair 97.7% |
| Immigrants | Ukraine | 22.7 /100 | #199 | Fair 97.7% |
| Immigrants | Albania | 22.6 /100 | #200 | Fair 97.7% |
| Immigrants | Lebanon | 21.7 /100 | #201 | Fair 97.7% |
| Immigrants | Southern Europe | 17.7 /100 | #202 | Poor 97.6% |
| Paiute | 16.7 /100 | #203 | Poor 97.6% |
| Immigrants | Chile | 16.5 /100 | #204 | Poor 97.6% |
| Africans | 14.5 /100 | #205 | Poor 97.6% |
| Immigrants | Northern Africa | 13.0 /100 | #206 | Poor 97.6% |
| Tohono O'odham | 12.5 /100 | #207 | Poor 97.6% |
| Immigrants | Zaire | 11.9 /100 | #208 | Poor 97.6% |
Demographics Similar to Immigrants from Afghanistan by 3rd Grade
In terms of 3rd grade, the demographic groups most similar to Immigrants from Afghanistan are Immigrants from Portugal (97.0%, a difference of 0.0%), British West Indian (97.0%, a difference of 0.010%), Immigrants from West Indies (97.1%, a difference of 0.040%), Immigrants from Thailand (97.1%, a difference of 0.040%), and Immigrants from Grenada (97.0%, a difference of 0.040%).
| Demographics | Rating | Rank | 3rd Grade |
| Immigrants | Trinidad and Tobago | 0.0 /100 | #284 | Tragic 97.1% |
| Immigrants | Hong Kong | 0.0 /100 | #285 | Tragic 97.1% |
| Immigrants | Barbados | 0.0 /100 | #286 | Tragic 97.1% |
| Immigrants | St. Vincent and the Grenadines | 0.0 /100 | #287 | Tragic 97.1% |
| Immigrants | West Indies | 0.0 /100 | #288 | Tragic 97.1% |
| Immigrants | Thailand | 0.0 /100 | #289 | Tragic 97.1% |
| Immigrants | Portugal | 0.0 /100 | #290 | Tragic 97.0% |
| Immigrants | Afghanistan | 0.0 /100 | #291 | Tragic 97.0% |
| British West Indians | 0.0 /100 | #292 | Tragic 97.0% |
| Immigrants | Grenada | 0.0 /100 | #293 | Tragic 97.0% |
| Malaysians | 0.0 /100 | #294 | Tragic 97.0% |
| Immigrants | Eritrea | 0.0 /100 | #295 | Tragic 97.0% |
| Immigrants | Immigrants | 0.0 /100 | #296 | Tragic 96.9% |
| Haitians | 0.0 /100 | #297 | Tragic 96.9% |
| Immigrants | Dominica | 0.0 /100 | #298 | Tragic 96.9% |