Fijian vs Immigrants from Afghanistan 3rd Grade
COMPARE
Fijian
Immigrants from Afghanistan
3rd Grade
3rd Grade Comparison
Fijians
Immigrants from Afghanistan
97.3%
3RD GRADE
0.2/ 100
METRIC RATING
269th/ 347
METRIC RANK
97.0%
3RD GRADE
0.0/ 100
METRIC RATING
291st/ 347
METRIC RANK
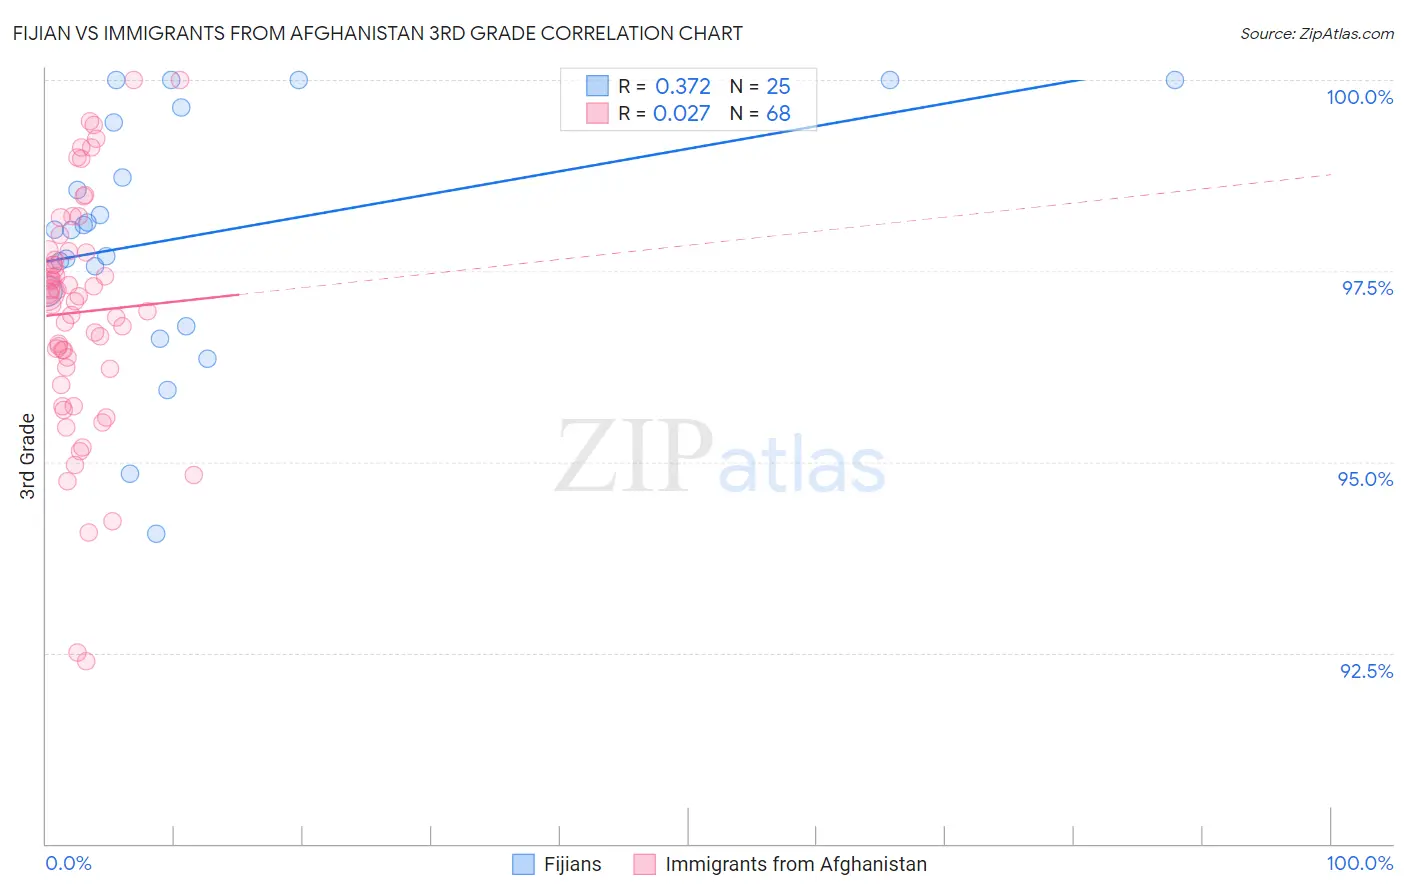
Fijian vs Immigrants from Afghanistan 3rd Grade Correlation Chart
The statistical analysis conducted on geographies consisting of 55,948,842 people shows a mild positive correlation between the proportion of Fijians and percentage of population with at least 3rd grade education in the United States with a correlation coefficient (R) of 0.372 and weighted average of 97.3%. Similarly, the statistical analysis conducted on geographies consisting of 147,629,924 people shows no correlation between the proportion of Immigrants from Afghanistan and percentage of population with at least 3rd grade education in the United States with a correlation coefficient (R) of 0.027 and weighted average of 97.0%, a difference of 0.23%.
3rd Grade Correlation Summary
| Measurement | Fijian | Immigrants from Afghanistan |
| Minimum | 94.1% | 92.4% |
| Maximum | 100.0% | 100.0% |
| Range | 5.9% | 7.6% |
| Mean | 98.0% | 97.0% |
| Median | 98.0% | 97.2% |
| Interquartile 25% (IQ1) | 97.0% | 96.2% |
| Interquartile 75% (IQ3) | 99.5% | 97.7% |
| Interquartile Range (IQR) | 2.5% | 1.5% |
| Standard Deviation (Sample) | 1.6% | 1.5% |
| Standard Deviation (Population) | 1.6% | 1.5% |
Similar Demographics by 3rd Grade
Demographics Similar to Fijians by 3rd Grade
In terms of 3rd grade, the demographic groups most similar to Fijians are Cuban (97.3%, a difference of 0.0%), Yaqui (97.3%, a difference of 0.010%), Immigrants from Nigeria (97.3%, a difference of 0.010%), Immigrants from Jamaica (97.3%, a difference of 0.020%), and Taiwanese (97.3%, a difference of 0.030%).
| Demographics | Rating | Rank | 3rd Grade |
| Immigrants | Sierra Leone | 0.4 /100 | #262 | Tragic 97.3% |
| Taiwanese | 0.3 /100 | #263 | Tragic 97.3% |
| West Indians | 0.3 /100 | #264 | Tragic 97.3% |
| Immigrants | Jamaica | 0.3 /100 | #265 | Tragic 97.3% |
| Yaqui | 0.3 /100 | #266 | Tragic 97.3% |
| Immigrants | Nigeria | 0.3 /100 | #267 | Tragic 97.3% |
| Cubans | 0.2 /100 | #268 | Tragic 97.3% |
| Fijians | 0.2 /100 | #269 | Tragic 97.3% |
| Immigrants | China | 0.2 /100 | #270 | Tragic 97.2% |
| Puerto Ricans | 0.2 /100 | #271 | Tragic 97.2% |
| Ghanaians | 0.1 /100 | #272 | Tragic 97.2% |
| Immigrants | Peru | 0.1 /100 | #273 | Tragic 97.2% |
| Immigrants | Cameroon | 0.1 /100 | #274 | Tragic 97.2% |
| Immigrants | Uzbekistan | 0.1 /100 | #275 | Tragic 97.2% |
| Immigrants | Bolivia | 0.1 /100 | #276 | Tragic 97.2% |
Demographics Similar to Immigrants from Afghanistan by 3rd Grade
In terms of 3rd grade, the demographic groups most similar to Immigrants from Afghanistan are Immigrants from Portugal (97.0%, a difference of 0.0%), British West Indian (97.0%, a difference of 0.010%), Immigrants from West Indies (97.1%, a difference of 0.040%), Immigrants from Thailand (97.1%, a difference of 0.040%), and Immigrants from Grenada (97.0%, a difference of 0.040%).
| Demographics | Rating | Rank | 3rd Grade |
| Immigrants | Trinidad and Tobago | 0.0 /100 | #284 | Tragic 97.1% |
| Immigrants | Hong Kong | 0.0 /100 | #285 | Tragic 97.1% |
| Immigrants | Barbados | 0.0 /100 | #286 | Tragic 97.1% |
| Immigrants | St. Vincent and the Grenadines | 0.0 /100 | #287 | Tragic 97.1% |
| Immigrants | West Indies | 0.0 /100 | #288 | Tragic 97.1% |
| Immigrants | Thailand | 0.0 /100 | #289 | Tragic 97.1% |
| Immigrants | Portugal | 0.0 /100 | #290 | Tragic 97.0% |
| Immigrants | Afghanistan | 0.0 /100 | #291 | Tragic 97.0% |
| British West Indians | 0.0 /100 | #292 | Tragic 97.0% |
| Immigrants | Grenada | 0.0 /100 | #293 | Tragic 97.0% |
| Malaysians | 0.0 /100 | #294 | Tragic 97.0% |
| Immigrants | Eritrea | 0.0 /100 | #295 | Tragic 97.0% |
| Immigrants | Immigrants | 0.0 /100 | #296 | Tragic 96.9% |
| Haitians | 0.0 /100 | #297 | Tragic 96.9% |
| Immigrants | Dominica | 0.0 /100 | #298 | Tragic 96.9% |