Immigrants from Kuwait vs Nepalese Doctorate Degree
COMPARE
Immigrants from Kuwait
Nepalese
Doctorate Degree
Doctorate Degree Comparison
Immigrants from Kuwait
Nepalese
2.6%
DOCTORATE DEGREE
100.0/ 100
METRIC RATING
37th/ 347
METRIC RANK
1.3%
DOCTORATE DEGREE
0.0/ 100
METRIC RATING
336th/ 347
METRIC RANK
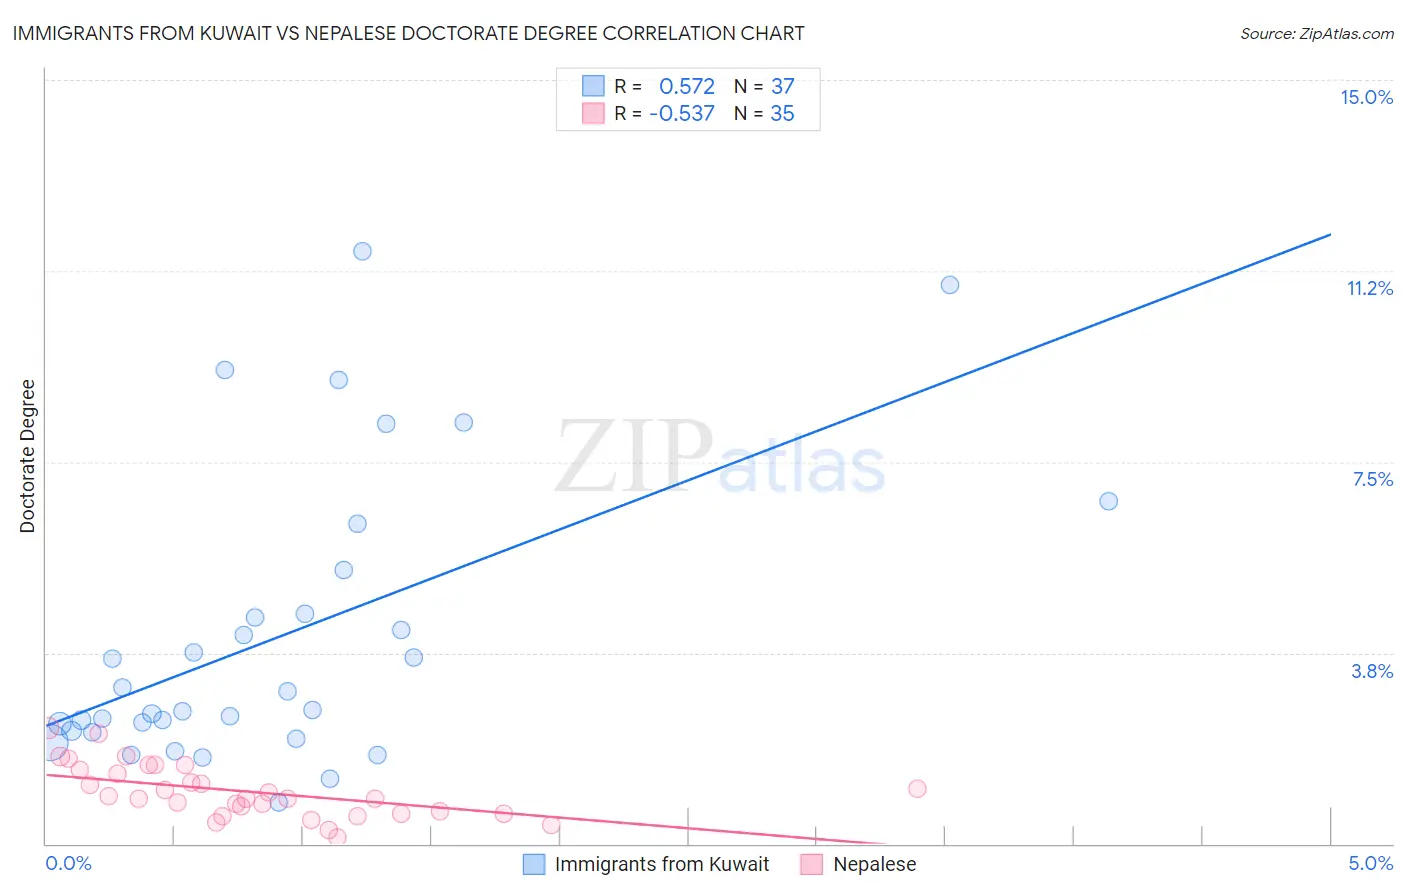
Immigrants from Kuwait vs Nepalese Doctorate Degree Correlation Chart
The statistical analysis conducted on geographies consisting of 136,719,755 people shows a substantial positive correlation between the proportion of Immigrants from Kuwait and percentage of population with at least doctorate degree education in the United States with a correlation coefficient (R) of 0.572 and weighted average of 2.6%. Similarly, the statistical analysis conducted on geographies consisting of 24,454,605 people shows a substantial negative correlation between the proportion of Nepalese and percentage of population with at least doctorate degree education in the United States with a correlation coefficient (R) of -0.537 and weighted average of 1.3%, a difference of 103.8%.
Doctorate Degree Correlation Summary
| Measurement | Immigrants from Kuwait | Nepalese |
| Minimum | 0.82% | 0.13% |
| Maximum | 11.6% | 2.3% |
| Range | 10.8% | 2.1% |
| Mean | 4.1% | 1.0% |
| Median | 2.6% | 0.89% |
| Interquartile 25% (IQ1) | 2.2% | 0.59% |
| Interquartile 75% (IQ3) | 4.9% | 1.5% |
| Interquartile Range (IQR) | 2.7% | 0.87% |
| Standard Deviation (Sample) | 2.8% | 0.52% |
| Standard Deviation (Population) | 2.8% | 0.51% |
Similar Demographics by Doctorate Degree
Demographics Similar to Immigrants from Kuwait by Doctorate Degree
In terms of doctorate degree, the demographic groups most similar to Immigrants from Kuwait are Russian (2.6%, a difference of 0.15%), Immigrants from Spain (2.6%, a difference of 0.26%), Immigrants from Malaysia (2.6%, a difference of 0.32%), Cypriot (2.6%, a difference of 0.38%), and Cambodian (2.6%, a difference of 0.50%).
| Demographics | Rating | Rank | Doctorate Degree |
| Immigrants | Korea | 100.0 /100 | #30 | Exceptional 2.6% |
| Latvians | 100.0 /100 | #31 | Exceptional 2.6% |
| Immigrants | Northern Europe | 100.0 /100 | #32 | Exceptional 2.6% |
| Cambodians | 100.0 /100 | #33 | Exceptional 2.6% |
| Cypriots | 100.0 /100 | #34 | Exceptional 2.6% |
| Immigrants | Malaysia | 100.0 /100 | #35 | Exceptional 2.6% |
| Immigrants | Spain | 100.0 /100 | #36 | Exceptional 2.6% |
| Immigrants | Kuwait | 100.0 /100 | #37 | Exceptional 2.6% |
| Russians | 100.0 /100 | #38 | Exceptional 2.6% |
| Immigrants | Ireland | 100.0 /100 | #39 | Exceptional 2.5% |
| Estonians | 100.0 /100 | #40 | Exceptional 2.5% |
| Immigrants | Russia | 100.0 /100 | #41 | Exceptional 2.5% |
| New Zealanders | 100.0 /100 | #42 | Exceptional 2.5% |
| Soviet Union | 100.0 /100 | #43 | Exceptional 2.5% |
| Immigrants | Netherlands | 100.0 /100 | #44 | Exceptional 2.5% |
Demographics Similar to Nepalese by Doctorate Degree
In terms of doctorate degree, the demographic groups most similar to Nepalese are Immigrants from Haiti (1.3%, a difference of 0.23%), Immigrants from Dominican Republic (1.3%, a difference of 2.0%), Immigrants from Caribbean (1.3%, a difference of 2.2%), Yakama (1.3%, a difference of 2.4%), and Bangladeshi (1.2%, a difference of 3.5%).
| Demographics | Rating | Rank | Doctorate Degree |
| Haitians | 0.0 /100 | #329 | Tragic 1.3% |
| Yup'ik | 0.0 /100 | #330 | Tragic 1.3% |
| Immigrants | Latin America | 0.0 /100 | #331 | Tragic 1.3% |
| Yakama | 0.0 /100 | #332 | Tragic 1.3% |
| Immigrants | Caribbean | 0.0 /100 | #333 | Tragic 1.3% |
| Immigrants | Dominican Republic | 0.0 /100 | #334 | Tragic 1.3% |
| Immigrants | Haiti | 0.0 /100 | #335 | Tragic 1.3% |
| Nepalese | 0.0 /100 | #336 | Tragic 1.3% |
| Bangladeshis | 0.0 /100 | #337 | Tragic 1.2% |
| Puget Sound Salish | 0.0 /100 | #338 | Tragic 1.2% |
| Immigrants | Central America | 0.0 /100 | #339 | Tragic 1.2% |
| Immigrants | Cuba | 0.0 /100 | #340 | Tragic 1.2% |
| Mexicans | 0.0 /100 | #341 | Tragic 1.2% |
| Arapaho | 0.0 /100 | #342 | Tragic 1.2% |
| Fijians | 0.0 /100 | #343 | Tragic 1.1% |