Immigrants from Kuwait vs Dutch West Indian Doctorate Degree
COMPARE
Immigrants from Kuwait
Dutch West Indian
Doctorate Degree
Doctorate Degree Comparison
Immigrants from Kuwait
Dutch West Indians
2.6%
DOCTORATE DEGREE
100.0/ 100
METRIC RATING
37th/ 347
METRIC RANK
1.3%
DOCTORATE DEGREE
0.1/ 100
METRIC RATING
321st/ 347
METRIC RANK
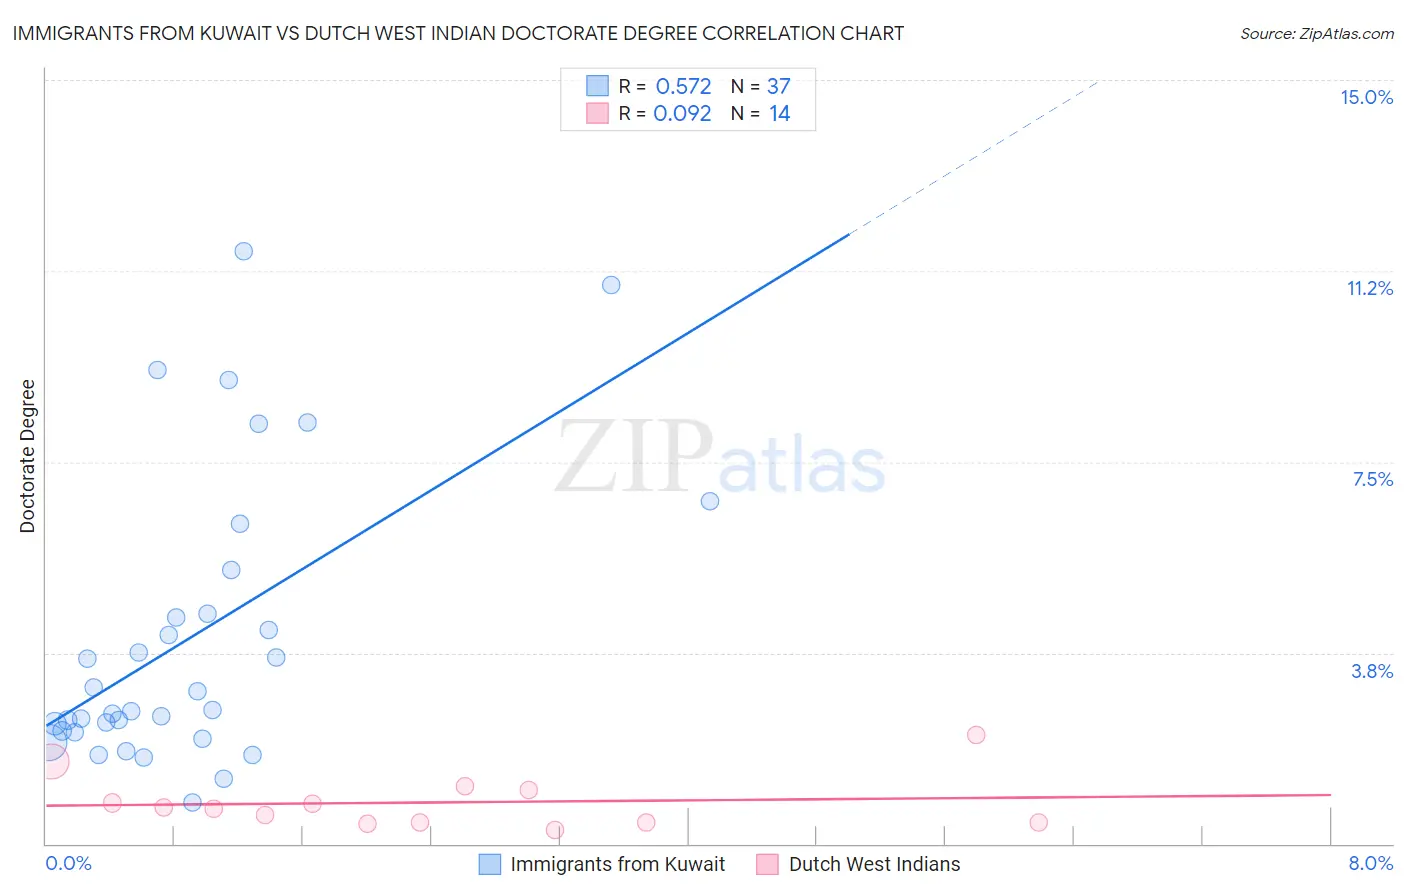
Immigrants from Kuwait vs Dutch West Indian Doctorate Degree Correlation Chart
The statistical analysis conducted on geographies consisting of 136,719,755 people shows a substantial positive correlation between the proportion of Immigrants from Kuwait and percentage of population with at least doctorate degree education in the United States with a correlation coefficient (R) of 0.572 and weighted average of 2.6%. Similarly, the statistical analysis conducted on geographies consisting of 84,429,780 people shows a slight positive correlation between the proportion of Dutch West Indians and percentage of population with at least doctorate degree education in the United States with a correlation coefficient (R) of 0.092 and weighted average of 1.3%, a difference of 91.9%.
Doctorate Degree Correlation Summary
| Measurement | Immigrants from Kuwait | Dutch West Indian |
| Minimum | 0.82% | 0.26% |
| Maximum | 11.6% | 2.1% |
| Range | 10.8% | 1.9% |
| Mean | 4.1% | 0.81% |
| Median | 2.6% | 0.70% |
| Interquartile 25% (IQ1) | 2.2% | 0.41% |
| Interquartile 75% (IQ3) | 4.9% | 1.1% |
| Interquartile Range (IQR) | 2.7% | 0.65% |
| Standard Deviation (Sample) | 2.8% | 0.53% |
| Standard Deviation (Population) | 2.8% | 0.51% |
Similar Demographics by Doctorate Degree
Demographics Similar to Immigrants from Kuwait by Doctorate Degree
In terms of doctorate degree, the demographic groups most similar to Immigrants from Kuwait are Russian (2.6%, a difference of 0.15%), Immigrants from Spain (2.6%, a difference of 0.26%), Immigrants from Malaysia (2.6%, a difference of 0.32%), Cypriot (2.6%, a difference of 0.38%), and Cambodian (2.6%, a difference of 0.50%).
| Demographics | Rating | Rank | Doctorate Degree |
| Immigrants | Korea | 100.0 /100 | #30 | Exceptional 2.6% |
| Latvians | 100.0 /100 | #31 | Exceptional 2.6% |
| Immigrants | Northern Europe | 100.0 /100 | #32 | Exceptional 2.6% |
| Cambodians | 100.0 /100 | #33 | Exceptional 2.6% |
| Cypriots | 100.0 /100 | #34 | Exceptional 2.6% |
| Immigrants | Malaysia | 100.0 /100 | #35 | Exceptional 2.6% |
| Immigrants | Spain | 100.0 /100 | #36 | Exceptional 2.6% |
| Immigrants | Kuwait | 100.0 /100 | #37 | Exceptional 2.6% |
| Russians | 100.0 /100 | #38 | Exceptional 2.6% |
| Immigrants | Ireland | 100.0 /100 | #39 | Exceptional 2.5% |
| Estonians | 100.0 /100 | #40 | Exceptional 2.5% |
| Immigrants | Russia | 100.0 /100 | #41 | Exceptional 2.5% |
| New Zealanders | 100.0 /100 | #42 | Exceptional 2.5% |
| Soviet Union | 100.0 /100 | #43 | Exceptional 2.5% |
| Immigrants | Netherlands | 100.0 /100 | #44 | Exceptional 2.5% |
Demographics Similar to Dutch West Indians by Doctorate Degree
In terms of doctorate degree, the demographic groups most similar to Dutch West Indians are Seminole (1.3%, a difference of 0.060%), Immigrants from St. Vincent and the Grenadines (1.3%, a difference of 0.11%), Immigrants from Guyana (1.3%, a difference of 0.17%), Immigrants from Belize (1.3%, a difference of 0.26%), and Native/Alaskan (1.3%, a difference of 0.58%).
| Demographics | Rating | Rank | Doctorate Degree |
| Dominicans | 0.1 /100 | #314 | Tragic 1.4% |
| Immigrants | Azores | 0.1 /100 | #315 | Tragic 1.4% |
| Navajo | 0.1 /100 | #316 | Tragic 1.4% |
| Immigrants | Micronesia | 0.1 /100 | #317 | Tragic 1.3% |
| Creek | 0.1 /100 | #318 | Tragic 1.3% |
| Immigrants | Guyana | 0.1 /100 | #319 | Tragic 1.3% |
| Immigrants | St. Vincent and the Grenadines | 0.1 /100 | #320 | Tragic 1.3% |
| Dutch West Indians | 0.1 /100 | #321 | Tragic 1.3% |
| Seminole | 0.1 /100 | #322 | Tragic 1.3% |
| Immigrants | Belize | 0.1 /100 | #323 | Tragic 1.3% |
| Natives/Alaskans | 0.0 /100 | #324 | Tragic 1.3% |
| Pima | 0.0 /100 | #325 | Tragic 1.3% |
| Immigrants | Cabo Verde | 0.0 /100 | #326 | Tragic 1.3% |
| Hispanics or Latinos | 0.0 /100 | #327 | Tragic 1.3% |
| Inupiat | 0.0 /100 | #328 | Tragic 1.3% |