Immigrants from Kuwait vs Immigrants from Liberia College, Under 1 year
COMPARE
Immigrants from Kuwait
Immigrants from Liberia
College, Under 1 year
College, Under 1 year Comparison
Immigrants from Kuwait
Immigrants from Liberia
70.3%
COLLEGE, UNDER 1 YEAR
99.9/ 100
METRIC RATING
41st/ 347
METRIC RANK
61.9%
COLLEGE, UNDER 1 YEAR
0.8/ 100
METRIC RATING
247th/ 347
METRIC RANK
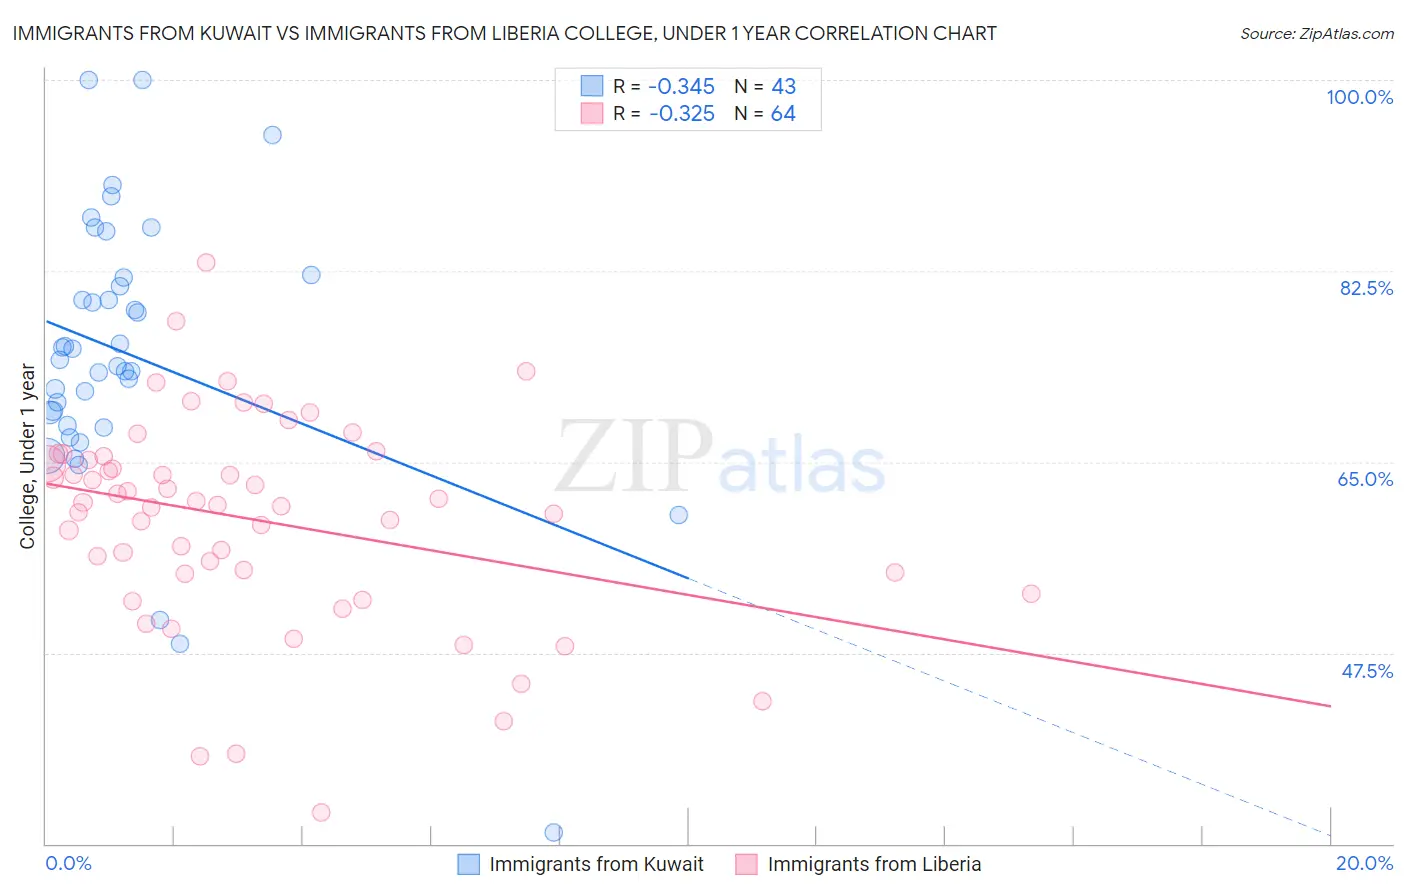
Immigrants from Kuwait vs Immigrants from Liberia College, Under 1 year Correlation Chart
The statistical analysis conducted on geographies consisting of 136,917,085 people shows a mild negative correlation between the proportion of Immigrants from Kuwait and percentage of population with at least college, under 1 year education in the United States with a correlation coefficient (R) of -0.345 and weighted average of 70.3%. Similarly, the statistical analysis conducted on geographies consisting of 135,295,665 people shows a mild negative correlation between the proportion of Immigrants from Liberia and percentage of population with at least college, under 1 year education in the United States with a correlation coefficient (R) of -0.325 and weighted average of 61.9%, a difference of 13.6%.
College, Under 1 year Correlation Summary
| Measurement | Immigrants from Kuwait | Immigrants from Liberia |
| Minimum | 31.0% | 32.8% |
| Maximum | 100.0% | 83.3% |
| Range | 69.0% | 50.5% |
| Mean | 74.8% | 59.7% |
| Median | 74.3% | 61.1% |
| Interquartile 25% (IQ1) | 68.3% | 54.8% |
| Interquartile 75% (IQ3) | 81.8% | 65.4% |
| Interquartile Range (IQR) | 13.5% | 10.6% |
| Standard Deviation (Sample) | 12.9% | 9.6% |
| Standard Deviation (Population) | 12.7% | 9.5% |
Similar Demographics by College, Under 1 year
Demographics Similar to Immigrants from Kuwait by College, Under 1 year
In terms of college, under 1 year, the demographic groups most similar to Immigrants from Kuwait are Immigrants from Turkey (70.3%, a difference of 0.040%), Bhutanese (70.3%, a difference of 0.050%), Immigrants from Lithuania (70.3%, a difference of 0.050%), Australian (70.4%, a difference of 0.070%), and Israeli (70.2%, a difference of 0.11%).
| Demographics | Rating | Rank | College, Under 1 year |
| Estonians | 99.9 /100 | #34 | Exceptional 70.6% |
| Russians | 99.9 /100 | #35 | Exceptional 70.5% |
| Immigrants | Sri Lanka | 99.9 /100 | #36 | Exceptional 70.5% |
| Immigrants | Saudi Arabia | 99.9 /100 | #37 | Exceptional 70.4% |
| Australians | 99.9 /100 | #38 | Exceptional 70.4% |
| Bhutanese | 99.9 /100 | #39 | Exceptional 70.3% |
| Immigrants | Turkey | 99.9 /100 | #40 | Exceptional 70.3% |
| Immigrants | Kuwait | 99.9 /100 | #41 | Exceptional 70.3% |
| Immigrants | Lithuania | 99.9 /100 | #42 | Exceptional 70.3% |
| Israelis | 99.9 /100 | #43 | Exceptional 70.2% |
| New Zealanders | 99.9 /100 | #44 | Exceptional 70.2% |
| Immigrants | Norway | 99.9 /100 | #45 | Exceptional 70.2% |
| Immigrants | Latvia | 99.9 /100 | #46 | Exceptional 70.1% |
| Immigrants | Bulgaria | 99.8 /100 | #47 | Exceptional 70.0% |
| Immigrants | Netherlands | 99.8 /100 | #48 | Exceptional 70.0% |
Demographics Similar to Immigrants from Liberia by College, Under 1 year
In terms of college, under 1 year, the demographic groups most similar to Immigrants from Liberia are Marshallese (61.9%, a difference of 0.020%), Potawatomi (61.8%, a difference of 0.23%), Delaware (62.1%, a difference of 0.25%), Colville (62.1%, a difference of 0.31%), and Hawaiian (62.1%, a difference of 0.40%).
| Demographics | Rating | Rank | College, Under 1 year |
| Aleuts | 1.1 /100 | #240 | Tragic 62.2% |
| Ottawa | 1.1 /100 | #241 | Tragic 62.2% |
| Malaysians | 1.1 /100 | #242 | Tragic 62.2% |
| Hawaiians | 1.1 /100 | #243 | Tragic 62.1% |
| Colville | 1.0 /100 | #244 | Tragic 62.1% |
| Delaware | 0.9 /100 | #245 | Tragic 62.1% |
| Marshallese | 0.8 /100 | #246 | Tragic 61.9% |
| Immigrants | Liberia | 0.8 /100 | #247 | Tragic 61.9% |
| Potawatomi | 0.6 /100 | #248 | Tragic 61.8% |
| Vietnamese | 0.5 /100 | #249 | Tragic 61.7% |
| Immigrants | Congo | 0.5 /100 | #250 | Tragic 61.7% |
| Immigrants | Micronesia | 0.5 /100 | #251 | Tragic 61.5% |
| West Indians | 0.4 /100 | #252 | Tragic 61.5% |
| Japanese | 0.4 /100 | #253 | Tragic 61.5% |
| Immigrants | Cambodia | 0.4 /100 | #254 | Tragic 61.5% |