Immigrants from Korea vs Subsaharan African Associate's Degree
COMPARE
Immigrants from Korea
Subsaharan African
Associate's Degree
Associate's Degree Comparison
Immigrants from Korea
Sub-Saharan Africans
54.5%
ASSOCIATE'S DEGREE
100.0/ 100
METRIC RATING
24th/ 347
METRIC RANK
43.9%
ASSOCIATE'S DEGREE
5.5/ 100
METRIC RATING
223rd/ 347
METRIC RANK
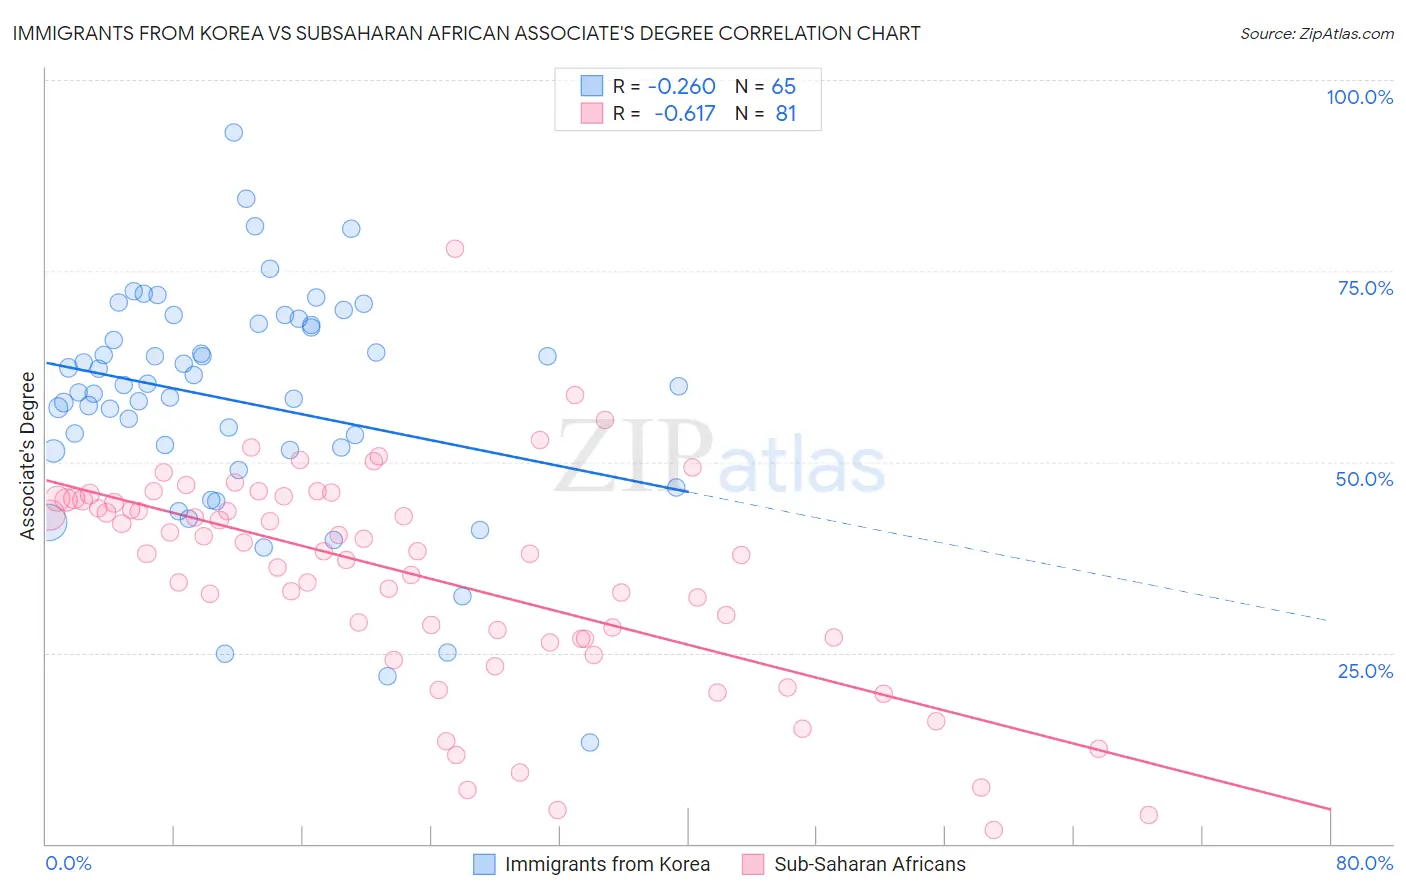
Immigrants from Korea vs Subsaharan African Associate's Degree Correlation Chart
The statistical analysis conducted on geographies consisting of 416,302,592 people shows a weak negative correlation between the proportion of Immigrants from Korea and percentage of population with at least associate's degree education in the United States with a correlation coefficient (R) of -0.260 and weighted average of 54.5%. Similarly, the statistical analysis conducted on geographies consisting of 508,152,134 people shows a significant negative correlation between the proportion of Sub-Saharan Africans and percentage of population with at least associate's degree education in the United States with a correlation coefficient (R) of -0.617 and weighted average of 43.9%, a difference of 24.3%.
Associate's Degree Correlation Summary
| Measurement | Immigrants from Korea | Subsaharan African |
| Minimum | 13.3% | 1.7% |
| Maximum | 93.1% | 78.0% |
| Range | 79.9% | 76.2% |
| Mean | 57.9% | 35.2% |
| Median | 59.9% | 38.3% |
| Interquartile 25% (IQ1) | 51.4% | 26.9% |
| Interquartile 75% (IQ3) | 68.0% | 45.1% |
| Interquartile Range (IQR) | 16.5% | 18.2% |
| Standard Deviation (Sample) | 14.9% | 14.2% |
| Standard Deviation (Population) | 14.8% | 14.1% |
Similar Demographics by Associate's Degree
Demographics Similar to Immigrants from Korea by Associate's Degree
In terms of associate's degree, the demographic groups most similar to Immigrants from Korea are Immigrants from Switzerland (54.5%, a difference of 0.030%), Immigrants from Belgium (54.5%, a difference of 0.070%), Immigrants from Japan (54.6%, a difference of 0.090%), Burmese (54.6%, a difference of 0.090%), and Immigrants from Sweden (54.6%, a difference of 0.12%).
| Demographics | Rating | Rank | Associate's Degree |
| Eastern Europeans | 100.0 /100 | #17 | Exceptional 55.0% |
| Indians (Asian) | 100.0 /100 | #18 | Exceptional 54.8% |
| Immigrants | Ireland | 100.0 /100 | #19 | Exceptional 54.7% |
| Cambodians | 100.0 /100 | #20 | Exceptional 54.6% |
| Immigrants | Sweden | 100.0 /100 | #21 | Exceptional 54.6% |
| Immigrants | Japan | 100.0 /100 | #22 | Exceptional 54.6% |
| Burmese | 100.0 /100 | #23 | Exceptional 54.6% |
| Immigrants | Korea | 100.0 /100 | #24 | Exceptional 54.5% |
| Immigrants | Switzerland | 100.0 /100 | #25 | Exceptional 54.5% |
| Immigrants | Belgium | 100.0 /100 | #26 | Exceptional 54.5% |
| Latvians | 100.0 /100 | #27 | Exceptional 53.9% |
| Turks | 100.0 /100 | #28 | Exceptional 53.9% |
| Immigrants | France | 100.0 /100 | #29 | Exceptional 53.9% |
| Immigrants | Sri Lanka | 100.0 /100 | #30 | Exceptional 53.7% |
| Immigrants | Northern Europe | 100.0 /100 | #31 | Exceptional 53.5% |
Demographics Similar to Sub-Saharan Africans by Associate's Degree
In terms of associate's degree, the demographic groups most similar to Sub-Saharan Africans are Barbadian (43.9%, a difference of 0.10%), West Indian (43.8%, a difference of 0.14%), Guamanian/Chamorro (43.8%, a difference of 0.29%), Immigrants from Western Africa (44.1%, a difference of 0.37%), and Immigrants from Burma/Myanmar (43.7%, a difference of 0.51%).
| Demographics | Rating | Rank | Associate's Degree |
| Immigrants | Nigeria | 11.4 /100 | #216 | Poor 44.6% |
| Immigrants | Immigrants | 10.5 /100 | #217 | Poor 44.5% |
| Spanish | 9.4 /100 | #218 | Tragic 44.4% |
| Whites/Caucasians | 7.5 /100 | #219 | Tragic 44.2% |
| Portuguese | 7.2 /100 | #220 | Tragic 44.1% |
| Immigrants | Western Africa | 6.6 /100 | #221 | Tragic 44.1% |
| Barbadians | 5.8 /100 | #222 | Tragic 43.9% |
| Sub-Saharan Africans | 5.5 /100 | #223 | Tragic 43.9% |
| West Indians | 5.2 /100 | #224 | Tragic 43.8% |
| Guamanians/Chamorros | 4.8 /100 | #225 | Tragic 43.8% |
| Immigrants | Burma/Myanmar | 4.3 /100 | #226 | Tragic 43.7% |
| Trinidadians and Tobagonians | 4.0 /100 | #227 | Tragic 43.6% |
| Hmong | 3.2 /100 | #228 | Tragic 43.4% |
| Immigrants | Trinidad and Tobago | 3.0 /100 | #229 | Tragic 43.3% |
| Immigrants | Barbados | 2.9 /100 | #230 | Tragic 43.3% |