Central American vs Subsaharan African Associate's Degree
COMPARE
Central American
Subsaharan African
Associate's Degree
Associate's Degree Comparison
Central Americans
Sub-Saharan Africans
39.4%
ASSOCIATE'S DEGREE
0.0/ 100
METRIC RATING
289th/ 347
METRIC RANK
43.9%
ASSOCIATE'S DEGREE
5.5/ 100
METRIC RATING
223rd/ 347
METRIC RANK
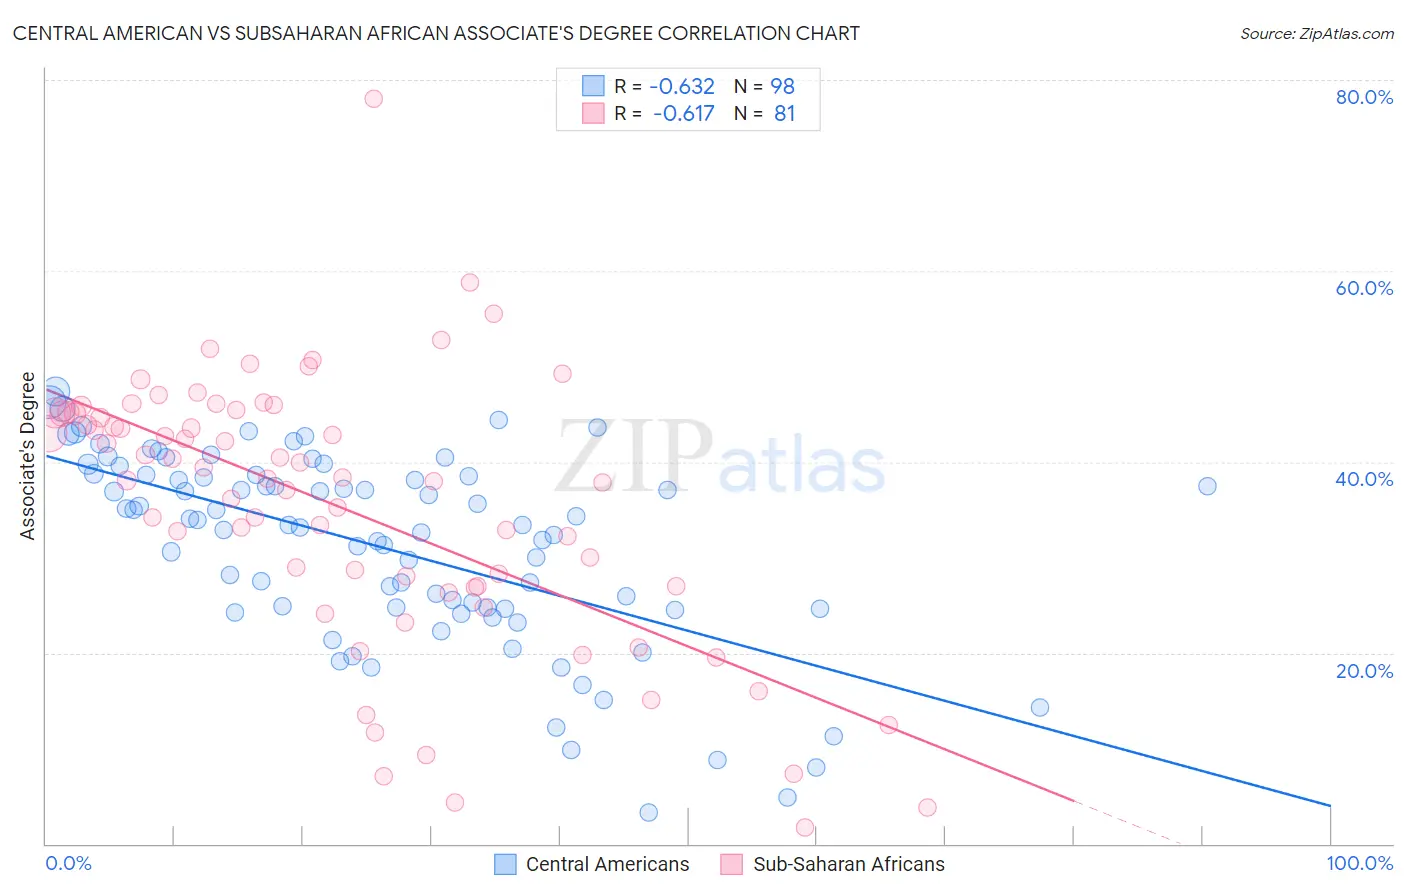
Central American vs Subsaharan African Associate's Degree Correlation Chart
The statistical analysis conducted on geographies consisting of 504,559,402 people shows a significant negative correlation between the proportion of Central Americans and percentage of population with at least associate's degree education in the United States with a correlation coefficient (R) of -0.632 and weighted average of 39.4%. Similarly, the statistical analysis conducted on geographies consisting of 508,152,134 people shows a significant negative correlation between the proportion of Sub-Saharan Africans and percentage of population with at least associate's degree education in the United States with a correlation coefficient (R) of -0.617 and weighted average of 43.9%, a difference of 11.3%.
Associate's Degree Correlation Summary
| Measurement | Central American | Subsaharan African |
| Minimum | 3.3% | 1.7% |
| Maximum | 47.4% | 78.0% |
| Range | 44.0% | 76.2% |
| Mean | 31.1% | 35.2% |
| Median | 33.4% | 38.3% |
| Interquartile 25% (IQ1) | 24.6% | 26.9% |
| Interquartile 75% (IQ3) | 38.6% | 45.1% |
| Interquartile Range (IQR) | 14.0% | 18.2% |
| Standard Deviation (Sample) | 10.1% | 14.2% |
| Standard Deviation (Population) | 10.0% | 14.1% |
Similar Demographics by Associate's Degree
Demographics Similar to Central Americans by Associate's Degree
In terms of associate's degree, the demographic groups most similar to Central Americans are Immigrants from Cuba (39.5%, a difference of 0.26%), Immigrants from Haiti (39.3%, a difference of 0.44%), Dominican (39.3%, a difference of 0.46%), Aleut (39.6%, a difference of 0.50%), and Black/African American (39.1%, a difference of 0.75%).
| Demographics | Rating | Rank | Associate's Degree |
| Bangladeshis | 0.1 /100 | #282 | Tragic 40.0% |
| Haitians | 0.1 /100 | #283 | Tragic 40.0% |
| Comanche | 0.1 /100 | #284 | Tragic 39.9% |
| Immigrants | Belize | 0.1 /100 | #285 | Tragic 39.9% |
| Immigrants | Caribbean | 0.0 /100 | #286 | Tragic 39.7% |
| Aleuts | 0.0 /100 | #287 | Tragic 39.6% |
| Immigrants | Cuba | 0.0 /100 | #288 | Tragic 39.5% |
| Central Americans | 0.0 /100 | #289 | Tragic 39.4% |
| Immigrants | Haiti | 0.0 /100 | #290 | Tragic 39.3% |
| Dominicans | 0.0 /100 | #291 | Tragic 39.3% |
| Blacks/African Americans | 0.0 /100 | #292 | Tragic 39.1% |
| Nepalese | 0.0 /100 | #293 | Tragic 39.0% |
| Salvadorans | 0.0 /100 | #294 | Tragic 39.0% |
| Hondurans | 0.0 /100 | #295 | Tragic 38.9% |
| Cherokee | 0.0 /100 | #296 | Tragic 38.9% |
Demographics Similar to Sub-Saharan Africans by Associate's Degree
In terms of associate's degree, the demographic groups most similar to Sub-Saharan Africans are Barbadian (43.9%, a difference of 0.10%), West Indian (43.8%, a difference of 0.14%), Guamanian/Chamorro (43.8%, a difference of 0.29%), Immigrants from Western Africa (44.1%, a difference of 0.37%), and Immigrants from Burma/Myanmar (43.7%, a difference of 0.51%).
| Demographics | Rating | Rank | Associate's Degree |
| Immigrants | Nigeria | 11.4 /100 | #216 | Poor 44.6% |
| Immigrants | Immigrants | 10.5 /100 | #217 | Poor 44.5% |
| Spanish | 9.4 /100 | #218 | Tragic 44.4% |
| Whites/Caucasians | 7.5 /100 | #219 | Tragic 44.2% |
| Portuguese | 7.2 /100 | #220 | Tragic 44.1% |
| Immigrants | Western Africa | 6.6 /100 | #221 | Tragic 44.1% |
| Barbadians | 5.8 /100 | #222 | Tragic 43.9% |
| Sub-Saharan Africans | 5.5 /100 | #223 | Tragic 43.9% |
| West Indians | 5.2 /100 | #224 | Tragic 43.8% |
| Guamanians/Chamorros | 4.8 /100 | #225 | Tragic 43.8% |
| Immigrants | Burma/Myanmar | 4.3 /100 | #226 | Tragic 43.7% |
| Trinidadians and Tobagonians | 4.0 /100 | #227 | Tragic 43.6% |
| Hmong | 3.2 /100 | #228 | Tragic 43.4% |
| Immigrants | Trinidad and Tobago | 3.0 /100 | #229 | Tragic 43.3% |
| Immigrants | Barbados | 2.9 /100 | #230 | Tragic 43.3% |