Immigrants from Kenya vs Uruguayan College, Under 1 year
COMPARE
Immigrants from Kenya
Uruguayan
College, Under 1 year
College, Under 1 year Comparison
Immigrants from Kenya
Uruguayans
66.5%
COLLEGE, UNDER 1 YEAR
81.8/ 100
METRIC RATING
145th/ 347
METRIC RANK
64.2%
COLLEGE, UNDER 1 YEAR
15.6/ 100
METRIC RATING
203rd/ 347
METRIC RANK
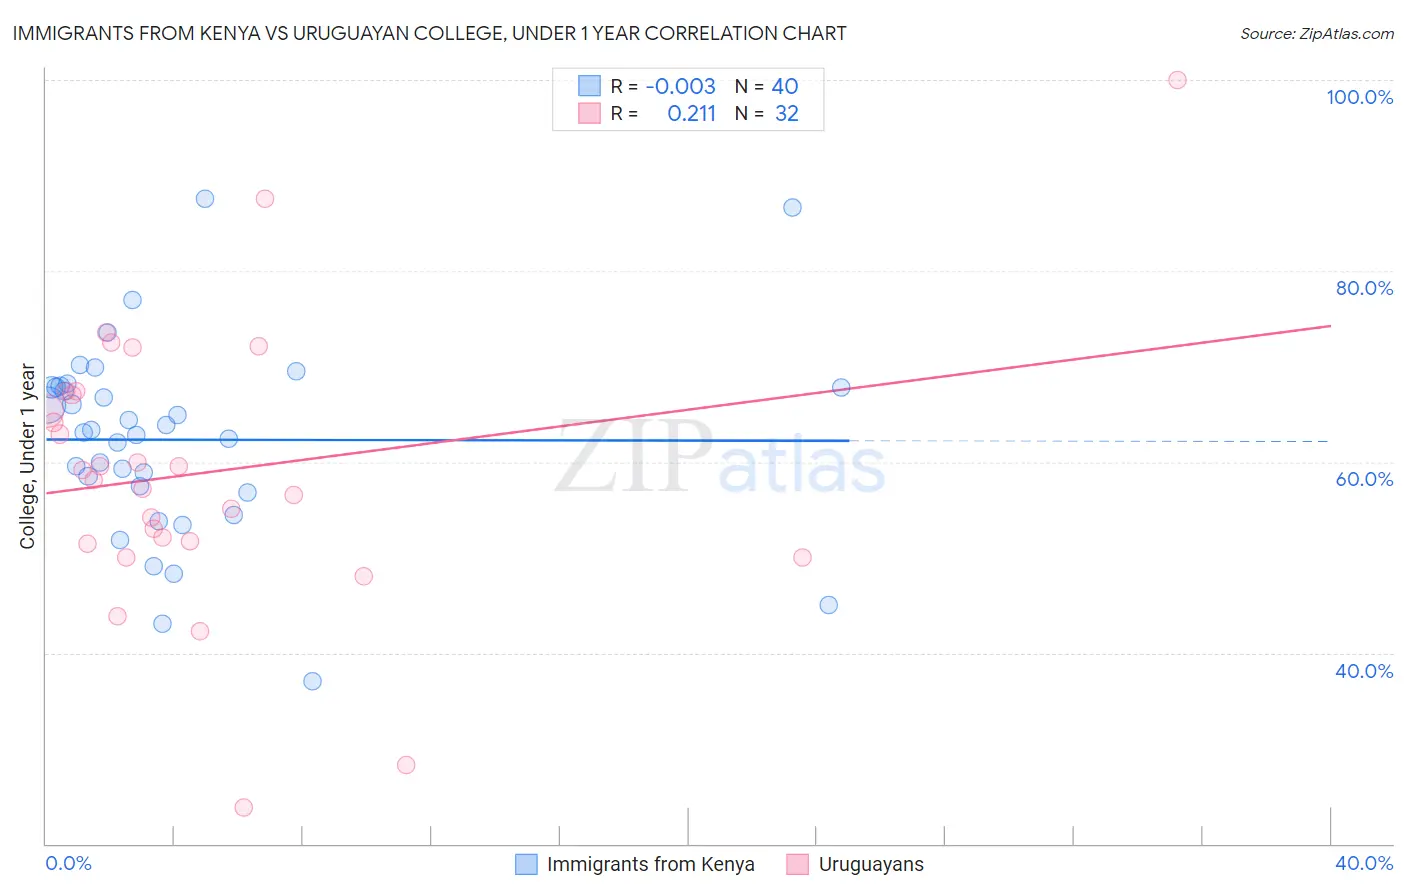
Immigrants from Kenya vs Uruguayan College, Under 1 year Correlation Chart
The statistical analysis conducted on geographies consisting of 218,085,582 people shows no correlation between the proportion of Immigrants from Kenya and percentage of population with at least college, under 1 year education in the United States with a correlation coefficient (R) of -0.003 and weighted average of 66.5%. Similarly, the statistical analysis conducted on geographies consisting of 144,782,794 people shows a weak positive correlation between the proportion of Uruguayans and percentage of population with at least college, under 1 year education in the United States with a correlation coefficient (R) of 0.211 and weighted average of 64.2%, a difference of 3.6%.
College, Under 1 year Correlation Summary
| Measurement | Immigrants from Kenya | Uruguayan |
| Minimum | 37.0% | 23.7% |
| Maximum | 87.6% | 100.0% |
| Range | 50.6% | 76.2% |
| Mean | 62.3% | 58.9% |
| Median | 63.2% | 58.7% |
| Interquartile 25% (IQ1) | 57.1% | 51.6% |
| Interquartile 75% (IQ3) | 67.8% | 67.2% |
| Interquartile Range (IQR) | 10.7% | 15.6% |
| Standard Deviation (Sample) | 10.3% | 14.8% |
| Standard Deviation (Population) | 10.1% | 14.5% |
Similar Demographics by College, Under 1 year
Demographics Similar to Immigrants from Kenya by College, Under 1 year
In terms of college, under 1 year, the demographic groups most similar to Immigrants from Kenya are Kenyan (66.5%, a difference of 0.0%), Immigrants from Germany (66.5%, a difference of 0.010%), Immigrants from Morocco (66.5%, a difference of 0.010%), Immigrants from Uganda (66.5%, a difference of 0.070%), and English (66.6%, a difference of 0.090%).
| Demographics | Rating | Rank | College, Under 1 year |
| Immigrants | Italy | 86.9 /100 | #138 | Excellent 66.8% |
| Venezuelans | 85.9 /100 | #139 | Excellent 66.7% |
| Slavs | 85.9 /100 | #140 | Excellent 66.7% |
| Immigrants | Afghanistan | 85.1 /100 | #141 | Excellent 66.7% |
| English | 82.9 /100 | #142 | Excellent 66.6% |
| Immigrants | Uganda | 82.8 /100 | #143 | Excellent 66.5% |
| Immigrants | Germany | 82.0 /100 | #144 | Excellent 66.5% |
| Immigrants | Kenya | 81.8 /100 | #145 | Excellent 66.5% |
| Kenyans | 81.7 /100 | #146 | Excellent 66.5% |
| Immigrants | Morocco | 81.7 /100 | #147 | Excellent 66.5% |
| Taiwanese | 78.6 /100 | #148 | Good 66.4% |
| Immigrants | Venezuela | 77.9 /100 | #149 | Good 66.3% |
| Immigrants | Iraq | 77.1 /100 | #150 | Good 66.3% |
| Immigrants | Sudan | 76.0 /100 | #151 | Good 66.2% |
| Sudanese | 74.1 /100 | #152 | Good 66.2% |
Demographics Similar to Uruguayans by College, Under 1 year
In terms of college, under 1 year, the demographic groups most similar to Uruguayans are French Canadian (64.2%, a difference of 0.050%), South American (64.2%, a difference of 0.050%), Nigerian (64.3%, a difference of 0.090%), Immigrants from Zaire (64.1%, a difference of 0.090%), and Panamanian (64.3%, a difference of 0.11%).
| Demographics | Rating | Rank | College, Under 1 year |
| Tongans | 21.2 /100 | #196 | Fair 64.5% |
| Costa Ricans | 19.6 /100 | #197 | Poor 64.4% |
| Tsimshian | 17.9 /100 | #198 | Poor 64.3% |
| Panamanians | 17.0 /100 | #199 | Poor 64.3% |
| Nigerians | 16.7 /100 | #200 | Poor 64.3% |
| French Canadians | 16.3 /100 | #201 | Poor 64.2% |
| South Americans | 16.2 /100 | #202 | Poor 64.2% |
| Uruguayans | 15.6 /100 | #203 | Poor 64.2% |
| Immigrants | Zaire | 14.6 /100 | #204 | Poor 64.1% |
| Peruvians | 13.7 /100 | #205 | Poor 64.1% |
| Whites/Caucasians | 12.8 /100 | #206 | Poor 64.0% |
| Colombians | 12.4 /100 | #207 | Poor 64.0% |
| Immigrants | Vietnam | 12.1 /100 | #208 | Poor 64.0% |
| Puget Sound Salish | 11.3 /100 | #209 | Poor 63.9% |
| Ghanaians | 11.2 /100 | #210 | Poor 63.9% |