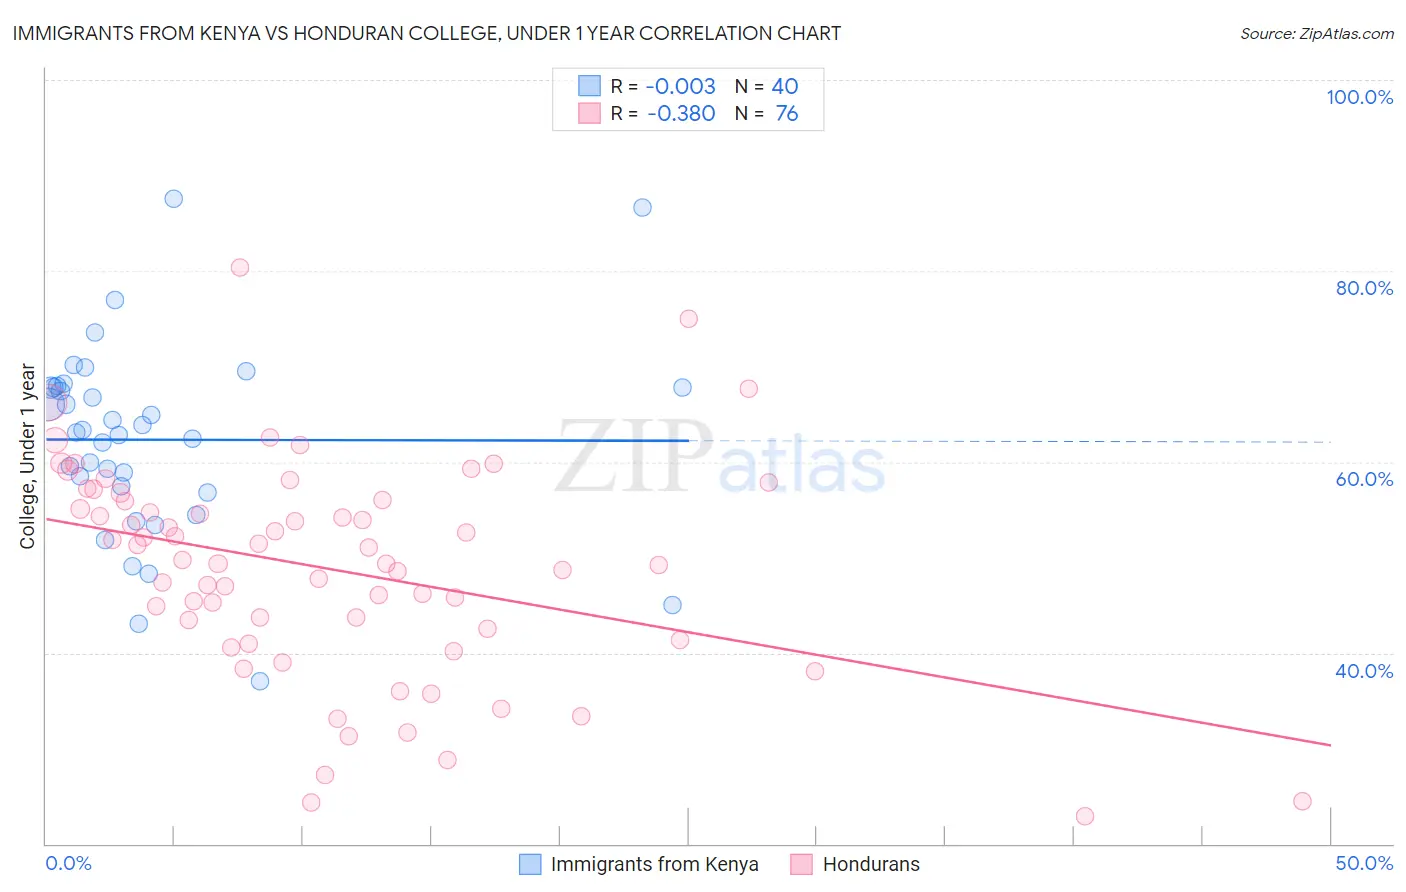
Immigrants from Kenya vs Honduran College, Under 1 year
COMPARE
Immigrants from Kenya
Honduran
College, Under 1 year
College, Under 1 year Comparison
Immigrants from Kenya
Hondurans
66.5%
COLLEGE, UNDER 1 YEAR
81.8/ 100
METRIC RATING
145th/ 347
METRIC RANK
57.1%
COLLEGE, UNDER 1 YEAR
0.0/ 100
METRIC RATING
315th/ 347
METRIC RANK
Immigrants from Kenya vs Honduran College, Under 1 year Correlation Chart
The statistical analysis conducted on geographies consisting of 218,085,582 people shows no correlation between the proportion of Immigrants from Kenya and percentage of population with at least college, under 1 year education in the United States with a correlation coefficient (R) of -0.003 and weighted average of 66.5%. Similarly, the statistical analysis conducted on geographies consisting of 357,856,249 people shows a mild negative correlation between the proportion of Hondurans and percentage of population with at least college, under 1 year education in the United States with a correlation coefficient (R) of -0.380 and weighted average of 57.1%, a difference of 16.5%.
College, Under 1 year Correlation Summary
| Measurement | Immigrants from Kenya | Honduran |
| Minimum | 37.0% | 22.9% |
| Maximum | 87.6% | 80.4% |
| Range | 50.6% | 57.4% |
| Mean | 62.3% | 48.8% |
| Median | 63.2% | 49.5% |
| Interquartile 25% (IQ1) | 57.1% | 41.9% |
| Interquartile 75% (IQ3) | 67.8% | 55.9% |
| Interquartile Range (IQR) | 10.7% | 14.0% |
| Standard Deviation (Sample) | 10.3% | 11.3% |
| Standard Deviation (Population) | 10.1% | 11.2% |
Similar Demographics by College, Under 1 year
Demographics Similar to Immigrants from Kenya by College, Under 1 year
In terms of college, under 1 year, the demographic groups most similar to Immigrants from Kenya are Kenyan (66.5%, a difference of 0.0%), Immigrants from Germany (66.5%, a difference of 0.010%), Immigrants from Morocco (66.5%, a difference of 0.010%), Immigrants from Uganda (66.5%, a difference of 0.070%), and English (66.6%, a difference of 0.090%).
| Demographics | Rating | Rank | College, Under 1 year |
| Immigrants | Italy | 86.9 /100 | #138 | Excellent 66.8% |
| Venezuelans | 85.9 /100 | #139 | Excellent 66.7% |
| Slavs | 85.9 /100 | #140 | Excellent 66.7% |
| Immigrants | Afghanistan | 85.1 /100 | #141 | Excellent 66.7% |
| English | 82.9 /100 | #142 | Excellent 66.6% |
| Immigrants | Uganda | 82.8 /100 | #143 | Excellent 66.5% |
| Immigrants | Germany | 82.0 /100 | #144 | Excellent 66.5% |
| Immigrants | Kenya | 81.8 /100 | #145 | Excellent 66.5% |
| Kenyans | 81.7 /100 | #146 | Excellent 66.5% |
| Immigrants | Morocco | 81.7 /100 | #147 | Excellent 66.5% |
| Taiwanese | 78.6 /100 | #148 | Good 66.4% |
| Immigrants | Venezuela | 77.9 /100 | #149 | Good 66.3% |
| Immigrants | Iraq | 77.1 /100 | #150 | Good 66.3% |
| Immigrants | Sudan | 76.0 /100 | #151 | Good 66.2% |
| Sudanese | 74.1 /100 | #152 | Good 66.2% |
Demographics Similar to Hondurans by College, Under 1 year
In terms of college, under 1 year, the demographic groups most similar to Hondurans are Hopi (57.1%, a difference of 0.040%), Menominee (57.0%, a difference of 0.050%), Hispanic or Latino (57.0%, a difference of 0.090%), Dutch West Indian (57.2%, a difference of 0.16%), and Immigrants from Haiti (56.9%, a difference of 0.21%).
| Demographics | Rating | Rank | College, Under 1 year |
| Central Americans | 0.0 /100 | #308 | Tragic 57.7% |
| Immigrants | Nicaragua | 0.0 /100 | #309 | Tragic 57.6% |
| Pueblo | 0.0 /100 | #310 | Tragic 57.4% |
| Cajuns | 0.0 /100 | #311 | Tragic 57.3% |
| Salvadorans | 0.0 /100 | #312 | Tragic 57.3% |
| Dutch West Indians | 0.0 /100 | #313 | Tragic 57.2% |
| Hopi | 0.0 /100 | #314 | Tragic 57.1% |
| Hondurans | 0.0 /100 | #315 | Tragic 57.1% |
| Menominee | 0.0 /100 | #316 | Tragic 57.0% |
| Hispanics or Latinos | 0.0 /100 | #317 | Tragic 57.0% |
| Immigrants | Haiti | 0.0 /100 | #318 | Tragic 56.9% |
| Puerto Ricans | 0.0 /100 | #319 | Tragic 56.8% |
| Guatemalans | 0.0 /100 | #320 | Tragic 56.8% |
| Natives/Alaskans | 0.0 /100 | #321 | Tragic 56.6% |
| Immigrants | Caribbean | 0.0 /100 | #322 | Tragic 56.6% |