Immigrants from Kenya vs Spaniard 5th Grade
COMPARE
Immigrants from Kenya
Spaniard
5th Grade
5th Grade Comparison
Immigrants from Kenya
Spaniards
97.3%
5TH GRADE
40.3/ 100
METRIC RATING
179th/ 347
METRIC RANK
97.5%
5TH GRADE
81.9/ 100
METRIC RATING
146th/ 347
METRIC RANK
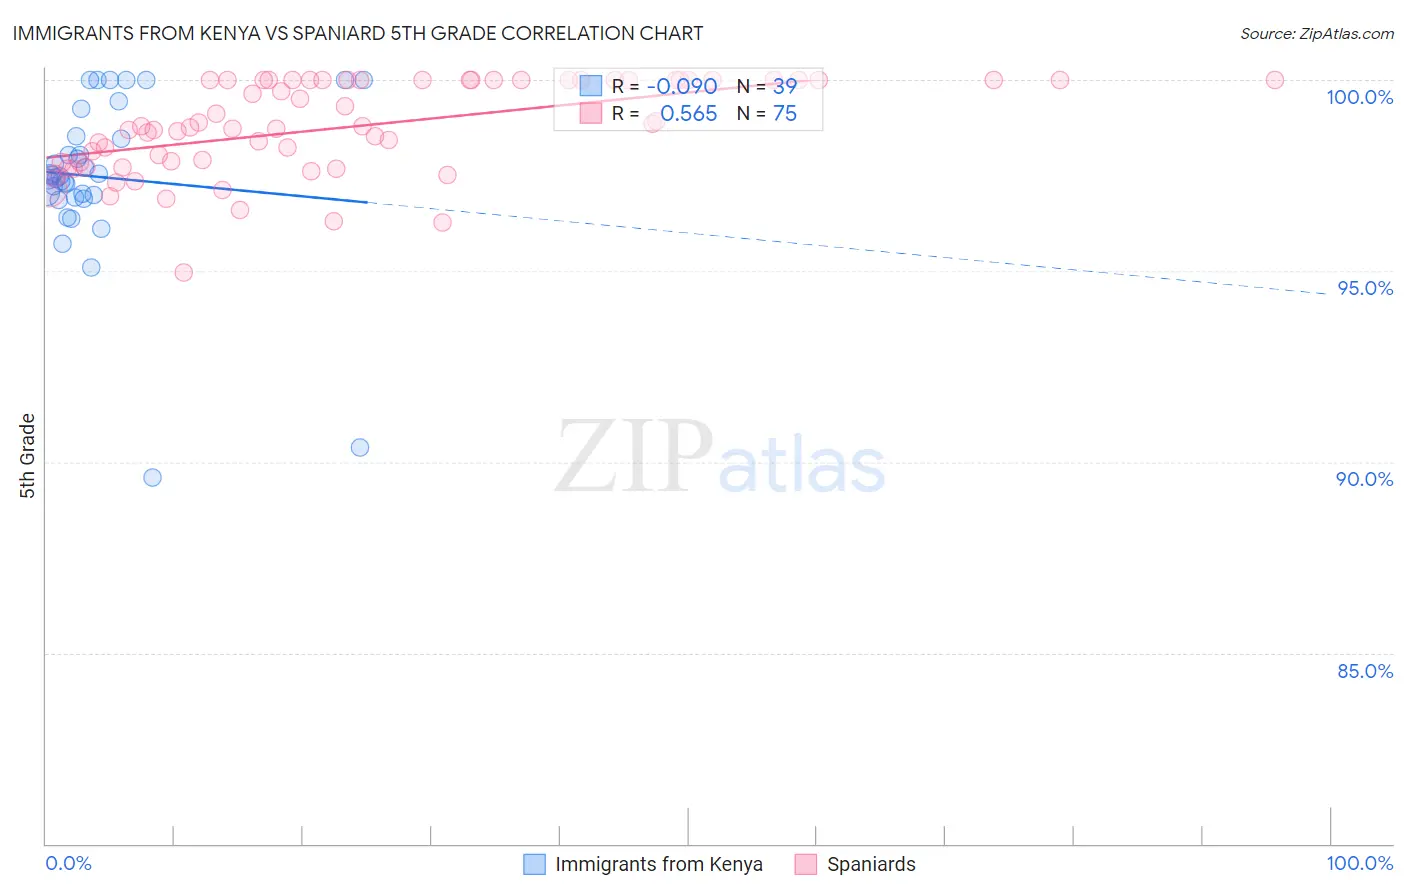
Immigrants from Kenya vs Spaniard 5th Grade Correlation Chart
The statistical analysis conducted on geographies consisting of 218,076,690 people shows a slight negative correlation between the proportion of Immigrants from Kenya and percentage of population with at least 5th grade education in the United States with a correlation coefficient (R) of -0.090 and weighted average of 97.3%. Similarly, the statistical analysis conducted on geographies consisting of 443,544,503 people shows a substantial positive correlation between the proportion of Spaniards and percentage of population with at least 5th grade education in the United States with a correlation coefficient (R) of 0.565 and weighted average of 97.5%, a difference of 0.20%.
5th Grade Correlation Summary
| Measurement | Immigrants from Kenya | Spaniard |
| Minimum | 89.6% | 94.9% |
| Maximum | 100.0% | 100.0% |
| Range | 10.4% | 5.1% |
| Mean | 97.5% | 98.8% |
| Median | 97.5% | 98.8% |
| Interquartile 25% (IQ1) | 96.9% | 97.8% |
| Interquartile 75% (IQ3) | 98.5% | 100.0% |
| Interquartile Range (IQR) | 1.6% | 2.2% |
| Standard Deviation (Sample) | 2.2% | 1.2% |
| Standard Deviation (Population) | 2.2% | 1.2% |
Similar Demographics by 5th Grade
Demographics Similar to Immigrants from Kenya by 5th Grade
In terms of 5th grade, the demographic groups most similar to Immigrants from Kenya are Pakistani (97.3%, a difference of 0.0%), Argentinean (97.3%, a difference of 0.0%), Mongolian (97.3%, a difference of 0.0%), Comanche (97.3%, a difference of 0.010%), and Immigrants from Ukraine (97.3%, a difference of 0.010%).
| Demographics | Rating | Rank | 5th Grade |
| Arabs | 53.4 /100 | #172 | Average 97.3% |
| Egyptians | 52.4 /100 | #173 | Average 97.3% |
| Immigrants | Kazakhstan | 50.0 /100 | #174 | Average 97.3% |
| Immigrants | Micronesia | 48.8 /100 | #175 | Average 97.3% |
| Immigrants | Taiwan | 48.4 /100 | #176 | Average 97.3% |
| Immigrants | Spain | 47.0 /100 | #177 | Average 97.3% |
| Comanche | 42.1 /100 | #178 | Average 97.3% |
| Immigrants | Kenya | 40.3 /100 | #179 | Average 97.3% |
| Pakistanis | 40.2 /100 | #180 | Average 97.3% |
| Argentineans | 39.5 /100 | #181 | Fair 97.3% |
| Mongolians | 39.4 /100 | #182 | Fair 97.3% |
| Immigrants | Ukraine | 38.6 /100 | #183 | Fair 97.3% |
| Immigrants | Venezuela | 38.4 /100 | #184 | Fair 97.3% |
| Dutch West Indians | 36.2 /100 | #185 | Fair 97.3% |
| Immigrants | Argentina | 36.1 /100 | #186 | Fair 97.3% |
Demographics Similar to Spaniards by 5th Grade
In terms of 5th grade, the demographic groups most similar to Spaniards are Jordanian (97.5%, a difference of 0.0%), Immigrants from Greece (97.5%, a difference of 0.010%), Soviet Union (97.5%, a difference of 0.010%), Immigrants from Israel (97.5%, a difference of 0.020%), and Hopi (97.5%, a difference of 0.020%).
| Demographics | Rating | Rank | 5th Grade |
| Immigrants | Turkey | 86.7 /100 | #139 | Excellent 97.5% |
| Burmese | 86.1 /100 | #140 | Excellent 97.5% |
| Seminole | 85.8 /100 | #141 | Excellent 97.5% |
| Israelis | 85.5 /100 | #142 | Excellent 97.5% |
| Immigrants | North Macedonia | 85.4 /100 | #143 | Excellent 97.5% |
| Immigrants | Greece | 83.2 /100 | #144 | Excellent 97.5% |
| Jordanians | 82.6 /100 | #145 | Excellent 97.5% |
| Spaniards | 81.9 /100 | #146 | Excellent 97.5% |
| Soviet Union | 81.2 /100 | #147 | Excellent 97.5% |
| Immigrants | Israel | 79.1 /100 | #148 | Good 97.5% |
| Hopi | 78.6 /100 | #149 | Good 97.5% |
| Immigrants | South Central Asia | 78.6 /100 | #150 | Good 97.5% |
| Immigrants | Eastern Europe | 75.0 /100 | #151 | Good 97.4% |
| Ute | 74.9 /100 | #152 | Good 97.4% |
| Alsatians | 74.3 /100 | #153 | Good 97.4% |