Immigrants from Kenya vs Canadian 5th Grade
COMPARE
Immigrants from Kenya
Canadian
5th Grade
5th Grade Comparison
Immigrants from Kenya
Canadians
97.3%
5TH GRADE
40.3/ 100
METRIC RATING
179th/ 347
METRIC RANK
97.9%
5TH GRADE
99.6/ 100
METRIC RATING
65th/ 347
METRIC RANK
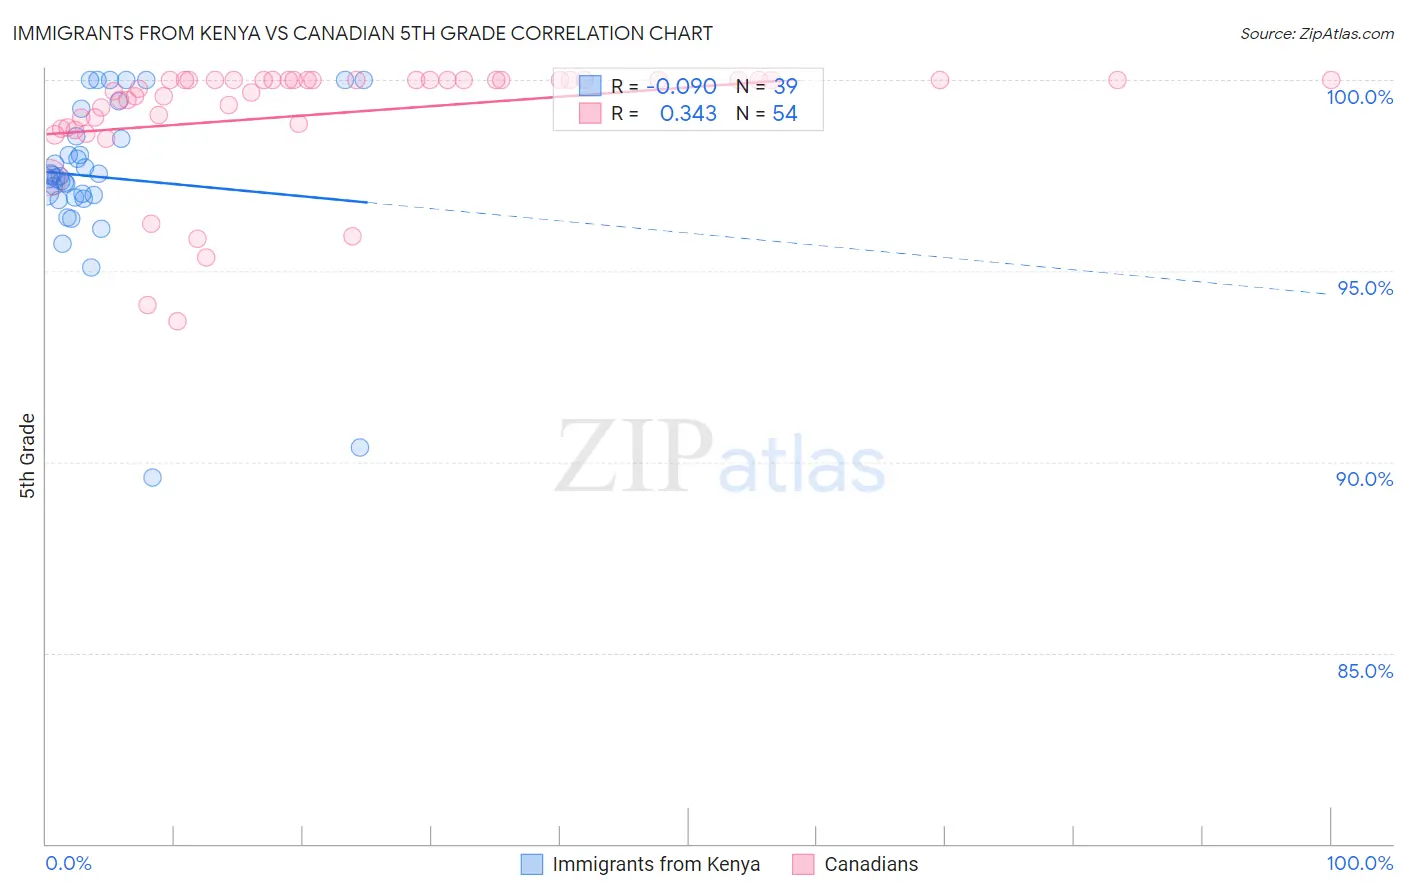
Immigrants from Kenya vs Canadian 5th Grade Correlation Chart
The statistical analysis conducted on geographies consisting of 218,076,690 people shows a slight negative correlation between the proportion of Immigrants from Kenya and percentage of population with at least 5th grade education in the United States with a correlation coefficient (R) of -0.090 and weighted average of 97.3%. Similarly, the statistical analysis conducted on geographies consisting of 437,556,929 people shows a mild positive correlation between the proportion of Canadians and percentage of population with at least 5th grade education in the United States with a correlation coefficient (R) of 0.343 and weighted average of 97.9%, a difference of 0.62%.
5th Grade Correlation Summary
| Measurement | Immigrants from Kenya | Canadian |
| Minimum | 89.6% | 93.7% |
| Maximum | 100.0% | 100.0% |
| Range | 10.4% | 6.3% |
| Mean | 97.5% | 99.1% |
| Median | 97.5% | 100.0% |
| Interquartile 25% (IQ1) | 96.9% | 98.9% |
| Interquartile 75% (IQ3) | 98.5% | 100.0% |
| Interquartile Range (IQR) | 1.6% | 1.1% |
| Standard Deviation (Sample) | 2.2% | 1.5% |
| Standard Deviation (Population) | 2.2% | 1.5% |
Similar Demographics by 5th Grade
Demographics Similar to Immigrants from Kenya by 5th Grade
In terms of 5th grade, the demographic groups most similar to Immigrants from Kenya are Pakistani (97.3%, a difference of 0.0%), Argentinean (97.3%, a difference of 0.0%), Mongolian (97.3%, a difference of 0.0%), Comanche (97.3%, a difference of 0.010%), and Immigrants from Ukraine (97.3%, a difference of 0.010%).
| Demographics | Rating | Rank | 5th Grade |
| Arabs | 53.4 /100 | #172 | Average 97.3% |
| Egyptians | 52.4 /100 | #173 | Average 97.3% |
| Immigrants | Kazakhstan | 50.0 /100 | #174 | Average 97.3% |
| Immigrants | Micronesia | 48.8 /100 | #175 | Average 97.3% |
| Immigrants | Taiwan | 48.4 /100 | #176 | Average 97.3% |
| Immigrants | Spain | 47.0 /100 | #177 | Average 97.3% |
| Comanche | 42.1 /100 | #178 | Average 97.3% |
| Immigrants | Kenya | 40.3 /100 | #179 | Average 97.3% |
| Pakistanis | 40.2 /100 | #180 | Average 97.3% |
| Argentineans | 39.5 /100 | #181 | Fair 97.3% |
| Mongolians | 39.4 /100 | #182 | Fair 97.3% |
| Immigrants | Ukraine | 38.6 /100 | #183 | Fair 97.3% |
| Immigrants | Venezuela | 38.4 /100 | #184 | Fair 97.3% |
| Dutch West Indians | 36.2 /100 | #185 | Fair 97.3% |
| Immigrants | Argentina | 36.1 /100 | #186 | Fair 97.3% |
Demographics Similar to Canadians by 5th Grade
In terms of 5th grade, the demographic groups most similar to Canadians are Immigrants from Northern Europe (97.9%, a difference of 0.0%), Immigrants from Austria (97.9%, a difference of 0.0%), New Zealander (97.9%, a difference of 0.0%), Cajun (97.9%, a difference of 0.010%), and Serbian (97.9%, a difference of 0.020%).
| Demographics | Rating | Rank | 5th Grade |
| Whites/Caucasians | 99.8 /100 | #58 | Exceptional 97.9% |
| Americans | 99.7 /100 | #59 | Exceptional 97.9% |
| Immigrants | Canada | 99.7 /100 | #60 | Exceptional 97.9% |
| Serbians | 99.7 /100 | #61 | Exceptional 97.9% |
| Immigrants | North America | 99.7 /100 | #62 | Exceptional 97.9% |
| Russians | 99.7 /100 | #63 | Exceptional 97.9% |
| Immigrants | Northern Europe | 99.6 /100 | #64 | Exceptional 97.9% |
| Canadians | 99.6 /100 | #65 | Exceptional 97.9% |
| Immigrants | Austria | 99.6 /100 | #66 | Exceptional 97.9% |
| New Zealanders | 99.6 /100 | #67 | Exceptional 97.9% |
| Cajuns | 99.6 /100 | #68 | Exceptional 97.9% |
| Kiowa | 99.5 /100 | #69 | Exceptional 97.9% |
| Iranians | 99.5 /100 | #70 | Exceptional 97.9% |
| Chickasaw | 99.5 /100 | #71 | Exceptional 97.9% |
| Macedonians | 99.4 /100 | #72 | Exceptional 97.9% |