Immigrants from Kenya vs Immigrants from Croatia Bachelor's Degree
COMPARE
Immigrants from Kenya
Immigrants from Croatia
Bachelor's Degree
Bachelor's Degree Comparison
Immigrants from Kenya
Immigrants from Croatia
38.8%
BACHELOR'S DEGREE
73.8/ 100
METRIC RATING
155th/ 347
METRIC RANK
42.3%
BACHELOR'S DEGREE
99.2/ 100
METRIC RATING
80th/ 347
METRIC RANK
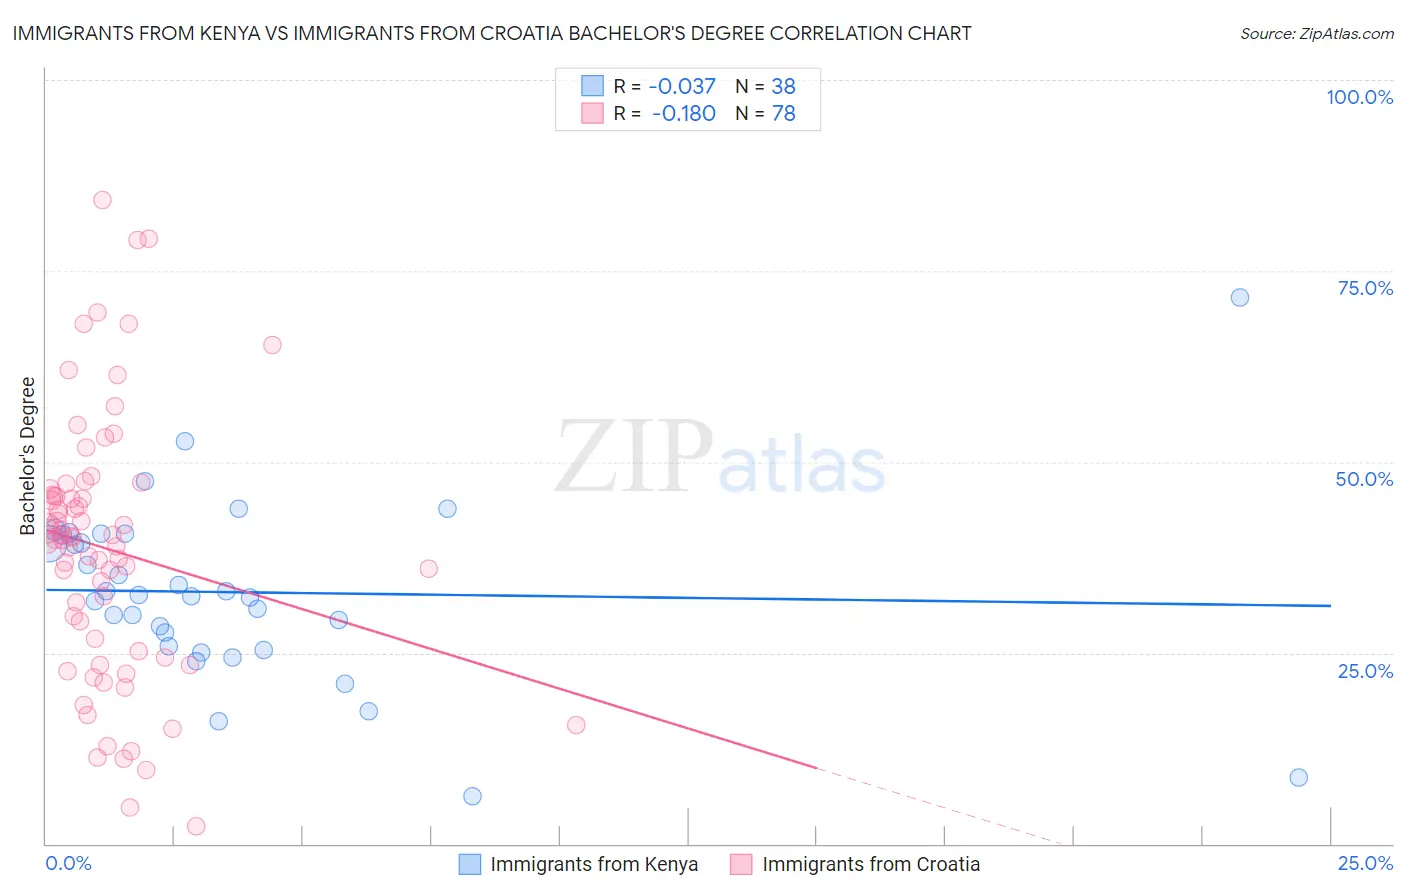
Immigrants from Kenya vs Immigrants from Croatia Bachelor's Degree Correlation Chart
The statistical analysis conducted on geographies consisting of 218,073,270 people shows no correlation between the proportion of Immigrants from Kenya and percentage of population with at least bachelor's degree education in the United States with a correlation coefficient (R) of -0.037 and weighted average of 38.8%. Similarly, the statistical analysis conducted on geographies consisting of 132,578,161 people shows a poor negative correlation between the proportion of Immigrants from Croatia and percentage of population with at least bachelor's degree education in the United States with a correlation coefficient (R) of -0.180 and weighted average of 42.3%, a difference of 9.1%.
Bachelor's Degree Correlation Summary
| Measurement | Immigrants from Kenya | Immigrants from Croatia |
| Minimum | 6.2% | 2.2% |
| Maximum | 71.6% | 84.3% |
| Range | 65.4% | 82.1% |
| Mean | 32.9% | 38.6% |
| Median | 32.5% | 39.9% |
| Interquartile 25% (IQ1) | 25.8% | 25.2% |
| Interquartile 75% (IQ3) | 40.5% | 45.6% |
| Interquartile Range (IQR) | 14.7% | 20.4% |
| Standard Deviation (Sample) | 11.8% | 17.2% |
| Standard Deviation (Population) | 11.7% | 17.1% |
Similar Demographics by Bachelor's Degree
Demographics Similar to Immigrants from Kenya by Bachelor's Degree
In terms of bachelor's degree, the demographic groups most similar to Immigrants from Kenya are Canadian (38.8%, a difference of 0.15%), Kenyan (38.7%, a difference of 0.15%), Slavic (38.9%, a difference of 0.27%), Sudanese (38.9%, a difference of 0.33%), and Immigrants from Africa (38.9%, a difference of 0.35%).
| Demographics | Rating | Rank | Bachelor's Degree |
| Iraqis | 78.1 /100 | #148 | Good 39.0% |
| Immigrants | Poland | 77.5 /100 | #149 | Good 39.0% |
| South Americans | 77.3 /100 | #150 | Good 38.9% |
| Immigrants | Africa | 76.5 /100 | #151 | Good 38.9% |
| Sudanese | 76.4 /100 | #152 | Good 38.9% |
| Slavs | 75.9 /100 | #153 | Good 38.9% |
| Canadians | 75.0 /100 | #154 | Good 38.8% |
| Immigrants | Kenya | 73.8 /100 | #155 | Good 38.8% |
| Kenyans | 72.5 /100 | #156 | Good 38.7% |
| Immigrants | South America | 70.1 /100 | #157 | Good 38.6% |
| Immigrants | Germany | 69.6 /100 | #158 | Good 38.6% |
| Chinese | 66.6 /100 | #159 | Good 38.5% |
| Vietnamese | 66.6 /100 | #160 | Good 38.5% |
| Uruguayans | 65.8 /100 | #161 | Good 38.4% |
| Colombians | 65.0 /100 | #162 | Good 38.4% |
Demographics Similar to Immigrants from Croatia by Bachelor's Degree
In terms of bachelor's degree, the demographic groups most similar to Immigrants from Croatia are Immigrants from Hungary (42.3%, a difference of 0.020%), Immigrants from Scotland (42.3%, a difference of 0.080%), Armenian (42.3%, a difference of 0.11%), Immigrants from Western Asia (42.3%, a difference of 0.13%), and Lithuanian (42.2%, a difference of 0.16%).
| Demographics | Rating | Rank | Bachelor's Degree |
| Immigrants | Uzbekistan | 99.5 /100 | #73 | Exceptional 42.8% |
| Bhutanese | 99.5 /100 | #74 | Exceptional 42.7% |
| Immigrants | Zimbabwe | 99.4 /100 | #75 | Exceptional 42.6% |
| Immigrants | Egypt | 99.4 /100 | #76 | Exceptional 42.6% |
| Immigrants | Eastern Europe | 99.4 /100 | #77 | Exceptional 42.5% |
| Immigrants | Ethiopia | 99.4 /100 | #78 | Exceptional 42.5% |
| Immigrants | Lebanon | 99.3 /100 | #79 | Exceptional 42.4% |
| Immigrants | Croatia | 99.2 /100 | #80 | Exceptional 42.3% |
| Immigrants | Hungary | 99.2 /100 | #81 | Exceptional 42.3% |
| Immigrants | Scotland | 99.2 /100 | #82 | Exceptional 42.3% |
| Armenians | 99.2 /100 | #83 | Exceptional 42.3% |
| Immigrants | Western Asia | 99.2 /100 | #84 | Exceptional 42.3% |
| Lithuanians | 99.2 /100 | #85 | Exceptional 42.2% |
| Immigrants | Brazil | 99.2 /100 | #86 | Exceptional 42.2% |
| Carpatho Rusyns | 99.0 /100 | #87 | Exceptional 42.1% |