Immigrants from Kenya vs Fijian Bachelor's Degree
COMPARE
Immigrants from Kenya
Fijian
Bachelor's Degree
Bachelor's Degree Comparison
Immigrants from Kenya
Fijians
38.8%
BACHELOR'S DEGREE
73.8/ 100
METRIC RATING
155th/ 347
METRIC RANK
28.7%
BACHELOR'S DEGREE
0.0/ 100
METRIC RATING
323rd/ 347
METRIC RANK
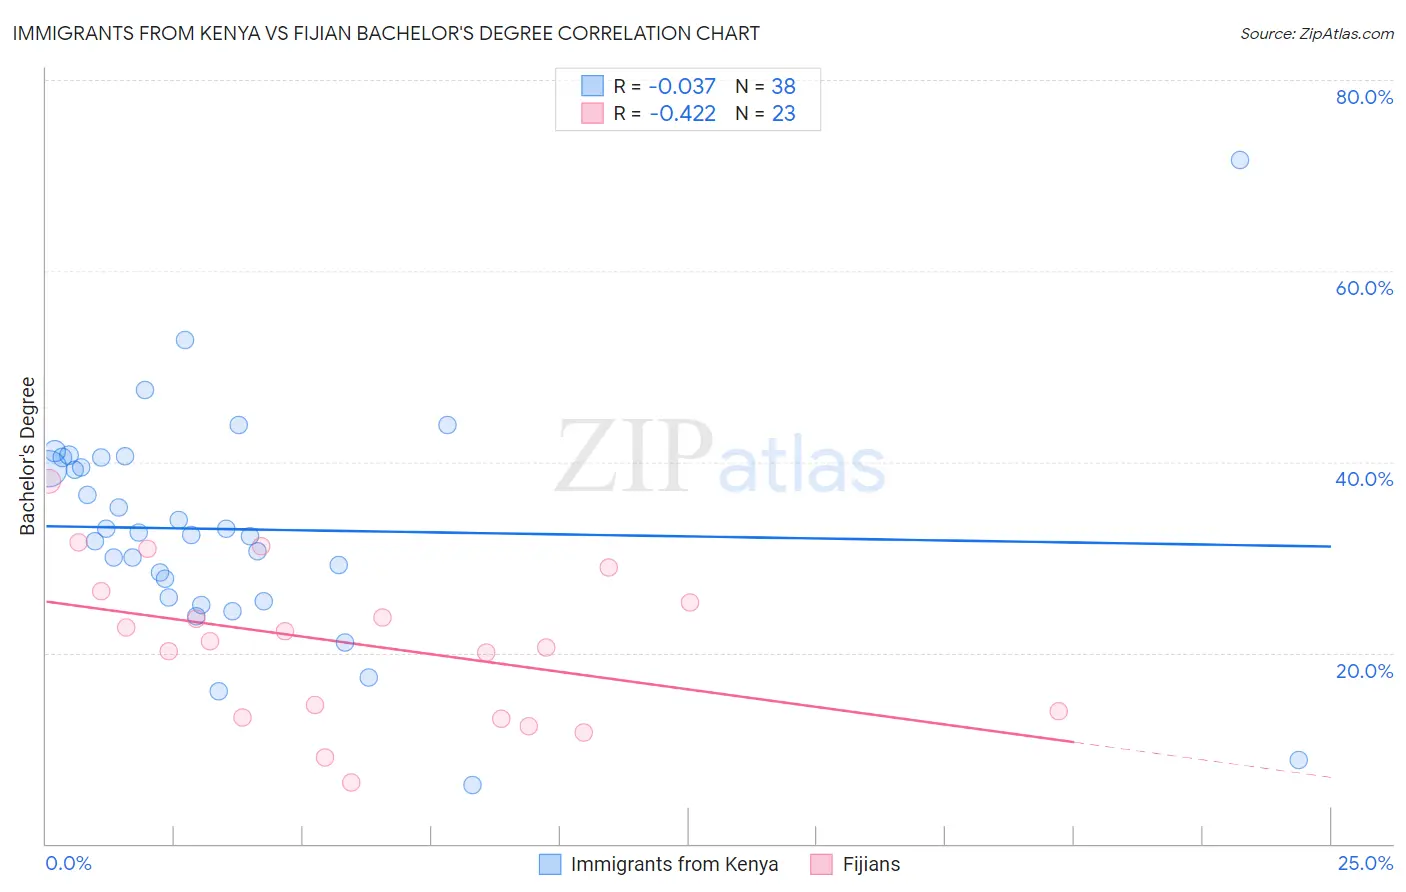
Immigrants from Kenya vs Fijian Bachelor's Degree Correlation Chart
The statistical analysis conducted on geographies consisting of 218,073,270 people shows no correlation between the proportion of Immigrants from Kenya and percentage of population with at least bachelor's degree education in the United States with a correlation coefficient (R) of -0.037 and weighted average of 38.8%. Similarly, the statistical analysis conducted on geographies consisting of 55,947,282 people shows a moderate negative correlation between the proportion of Fijians and percentage of population with at least bachelor's degree education in the United States with a correlation coefficient (R) of -0.422 and weighted average of 28.7%, a difference of 35.0%.
Bachelor's Degree Correlation Summary
| Measurement | Immigrants from Kenya | Fijian |
| Minimum | 6.2% | 6.4% |
| Maximum | 71.6% | 37.9% |
| Range | 65.4% | 31.5% |
| Mean | 32.9% | 20.9% |
| Median | 32.5% | 21.2% |
| Interquartile 25% (IQ1) | 25.8% | 13.2% |
| Interquartile 75% (IQ3) | 40.5% | 26.5% |
| Interquartile Range (IQR) | 14.7% | 13.2% |
| Standard Deviation (Sample) | 11.8% | 8.2% |
| Standard Deviation (Population) | 11.7% | 8.0% |
Similar Demographics by Bachelor's Degree
Demographics Similar to Immigrants from Kenya by Bachelor's Degree
In terms of bachelor's degree, the demographic groups most similar to Immigrants from Kenya are Canadian (38.8%, a difference of 0.15%), Kenyan (38.7%, a difference of 0.15%), Slavic (38.9%, a difference of 0.27%), Sudanese (38.9%, a difference of 0.33%), and Immigrants from Africa (38.9%, a difference of 0.35%).
| Demographics | Rating | Rank | Bachelor's Degree |
| Iraqis | 78.1 /100 | #148 | Good 39.0% |
| Immigrants | Poland | 77.5 /100 | #149 | Good 39.0% |
| South Americans | 77.3 /100 | #150 | Good 38.9% |
| Immigrants | Africa | 76.5 /100 | #151 | Good 38.9% |
| Sudanese | 76.4 /100 | #152 | Good 38.9% |
| Slavs | 75.9 /100 | #153 | Good 38.9% |
| Canadians | 75.0 /100 | #154 | Good 38.8% |
| Immigrants | Kenya | 73.8 /100 | #155 | Good 38.8% |
| Kenyans | 72.5 /100 | #156 | Good 38.7% |
| Immigrants | South America | 70.1 /100 | #157 | Good 38.6% |
| Immigrants | Germany | 69.6 /100 | #158 | Good 38.6% |
| Chinese | 66.6 /100 | #159 | Good 38.5% |
| Vietnamese | 66.6 /100 | #160 | Good 38.5% |
| Uruguayans | 65.8 /100 | #161 | Good 38.4% |
| Colombians | 65.0 /100 | #162 | Good 38.4% |
Demographics Similar to Fijians by Bachelor's Degree
In terms of bachelor's degree, the demographic groups most similar to Fijians are Tsimshian (28.8%, a difference of 0.14%), Alaskan Athabascan (28.8%, a difference of 0.36%), Kiowa (28.8%, a difference of 0.44%), Creek (28.9%, a difference of 0.48%), and Dutch West Indian (28.5%, a difference of 0.71%).
| Demographics | Rating | Rank | Bachelor's Degree |
| Sioux | 0.0 /100 | #316 | Tragic 29.1% |
| Colville | 0.0 /100 | #317 | Tragic 29.0% |
| Yaqui | 0.0 /100 | #318 | Tragic 29.0% |
| Creek | 0.0 /100 | #319 | Tragic 28.9% |
| Kiowa | 0.0 /100 | #320 | Tragic 28.8% |
| Alaskan Athabascans | 0.0 /100 | #321 | Tragic 28.8% |
| Tsimshian | 0.0 /100 | #322 | Tragic 28.8% |
| Fijians | 0.0 /100 | #323 | Tragic 28.7% |
| Dutch West Indians | 0.0 /100 | #324 | Tragic 28.5% |
| Pennsylvania Germans | 0.0 /100 | #325 | Tragic 28.4% |
| Apache | 0.0 /100 | #326 | Tragic 28.3% |
| Paiute | 0.0 /100 | #327 | Tragic 28.1% |
| Crow | 0.0 /100 | #328 | Tragic 27.7% |
| Immigrants | Central America | 0.0 /100 | #329 | Tragic 27.5% |
| Spanish American Indians | 0.0 /100 | #330 | Tragic 27.5% |