Immigrants from Jordan vs South American Indian Associate's Degree
COMPARE
Immigrants from Jordan
South American Indian
Associate's Degree
Associate's Degree Comparison
Immigrants from Jordan
South American Indians
48.4%
ASSOCIATE'S DEGREE
91.2/ 100
METRIC RATING
130th/ 347
METRIC RANK
47.4%
ASSOCIATE'S DEGREE
76.7/ 100
METRIC RATING
148th/ 347
METRIC RANK
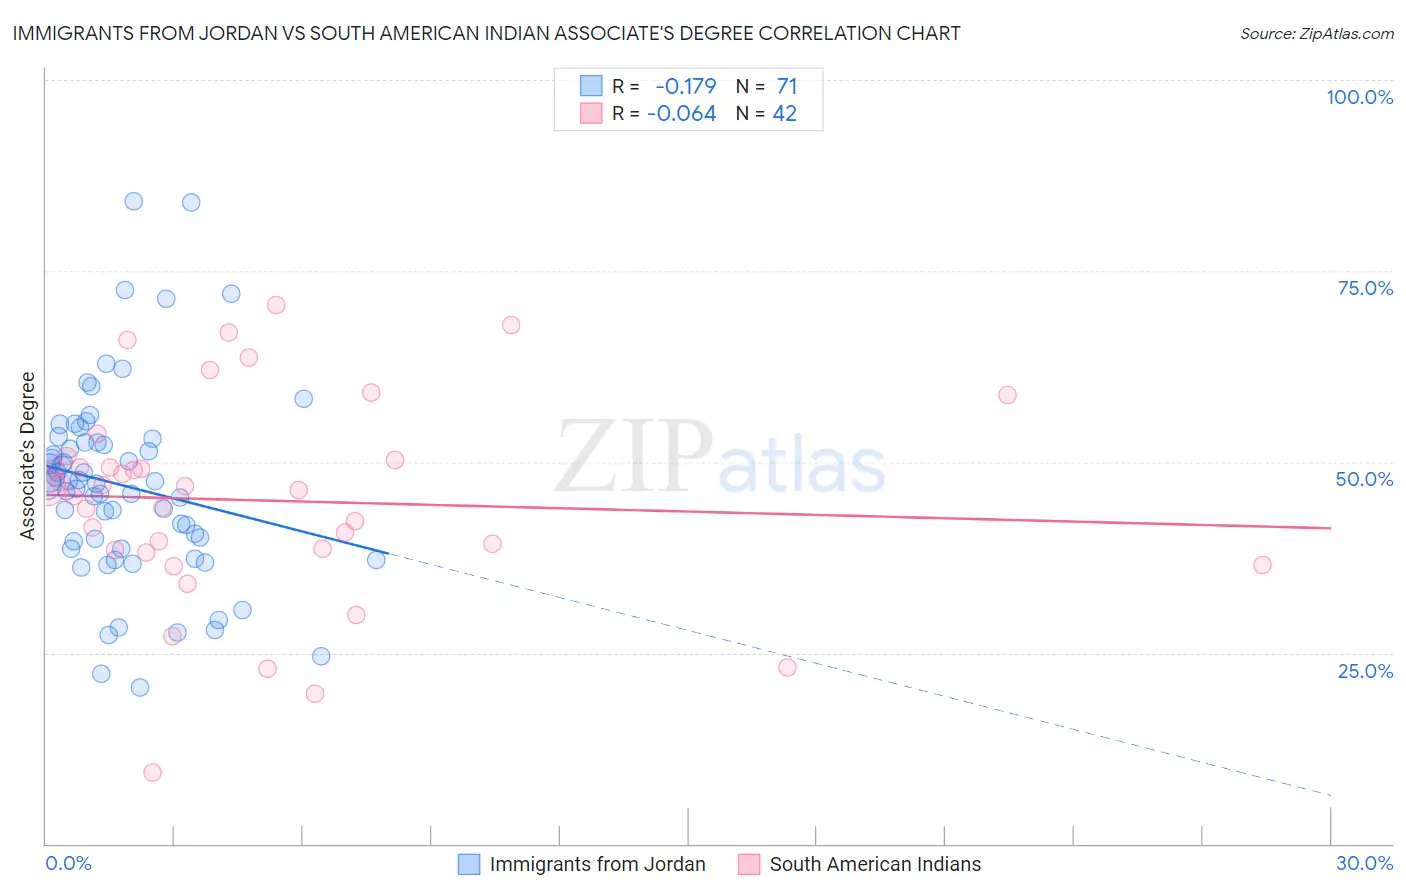
Immigrants from Jordan vs South American Indian Associate's Degree Correlation Chart
The statistical analysis conducted on geographies consisting of 181,277,239 people shows a poor negative correlation between the proportion of Immigrants from Jordan and percentage of population with at least associate's degree education in the United States with a correlation coefficient (R) of -0.179 and weighted average of 48.4%. Similarly, the statistical analysis conducted on geographies consisting of 164,573,088 people shows a slight negative correlation between the proportion of South American Indians and percentage of population with at least associate's degree education in the United States with a correlation coefficient (R) of -0.064 and weighted average of 47.4%, a difference of 2.1%.
Associate's Degree Correlation Summary
| Measurement | Immigrants from Jordan | South American Indian |
| Minimum | 20.5% | 9.4% |
| Maximum | 84.2% | 70.6% |
| Range | 63.7% | 61.2% |
| Mean | 46.9% | 45.0% |
| Median | 47.1% | 46.5% |
| Interquartile 25% (IQ1) | 38.6% | 38.4% |
| Interquartile 75% (IQ3) | 52.6% | 50.2% |
| Interquartile Range (IQR) | 14.0% | 11.8% |
| Standard Deviation (Sample) | 12.7% | 13.3% |
| Standard Deviation (Population) | 12.6% | 13.2% |
Demographics Similar to Immigrants from Jordan and South American Indians by Associate's Degree
In terms of associate's degree, the demographic groups most similar to Immigrants from Jordan are Swedish (48.4%, a difference of 0.060%), Icelander (48.3%, a difference of 0.10%), Immigrants from Albania (48.2%, a difference of 0.29%), Assyrian/Chaldean/Syriac (48.2%, a difference of 0.37%), and Moroccan (48.2%, a difference of 0.39%). Similarly, the demographic groups most similar to South American Indians are Immigrants from Armenia (47.4%, a difference of 0.010%), Danish (47.4%, a difference of 0.060%), Immigrants from Sudan (47.4%, a difference of 0.12%), Canadian (47.5%, a difference of 0.24%), and Slavic (47.6%, a difference of 0.42%).
| Demographics | Rating | Rank | Associate's Degree |
| Swedes | 91.5 /100 | #129 | Exceptional 48.4% |
| Immigrants | Jordan | 91.2 /100 | #130 | Exceptional 48.4% |
| Icelanders | 90.8 /100 | #131 | Exceptional 48.3% |
| Immigrants | Albania | 89.9 /100 | #132 | Excellent 48.2% |
| Assyrians/Chaldeans/Syriacs | 89.4 /100 | #133 | Excellent 48.2% |
| Moroccans | 89.3 /100 | #134 | Excellent 48.2% |
| Europeans | 89.0 /100 | #135 | Excellent 48.2% |
| Pakistanis | 88.0 /100 | #136 | Excellent 48.1% |
| Immigrants | Eritrea | 87.8 /100 | #137 | Excellent 48.1% |
| Poles | 87.3 /100 | #138 | Excellent 48.0% |
| Slovenes | 85.1 /100 | #139 | Excellent 47.9% |
| Immigrants | Southern Europe | 84.4 /100 | #140 | Excellent 47.8% |
| Taiwanese | 83.3 /100 | #141 | Excellent 47.7% |
| Sierra Leoneans | 82.9 /100 | #142 | Excellent 47.7% |
| Norwegians | 81.0 /100 | #143 | Excellent 47.6% |
| Slavs | 80.5 /100 | #144 | Excellent 47.6% |
| Canadians | 79.0 /100 | #145 | Good 47.5% |
| Immigrants | Sudan | 77.9 /100 | #146 | Good 47.4% |
| Danes | 77.3 /100 | #147 | Good 47.4% |
| South American Indians | 76.7 /100 | #148 | Good 47.4% |
| Immigrants | Armenia | 76.6 /100 | #149 | Good 47.4% |