Immigrants from Jordan vs Immigrants from Hungary Bachelor's Degree

COMPARE

Immigrants from Jordan
Race
Ancestry
AfghanAfricanAlaska NativeAlaskan AthabascanAlbanianAleutAlsatianAmericanApacheArabArapahoArgentineanArmenianAssyrian/Chaldean/SyriacAustralianAustrianBahamianBangladeshiBarbadianBasqueBelgianBelizeanBermudanBhutaneseBlackfeetBolivianBrazilianBritishBritish West IndianBulgarianBurmeseCajunCambodianCanadianCape VerdeanCarpatho RusynCelticCentral AmericanCentral American IndianCherokeeCheyenneChickasawChileanChineseChippewaChoctawColombianColvilleComancheCosta RicanCreeCreekCroatianCrowCubanCypriotCzechCzechoslovakianDanishDelawareDominicanDutchDutch West IndianEastern EuropeanEcuadorianEgyptianEnglishEstonianEthiopianEuropeanFijianFilipinoFinnishFrenchFrench American IndianFrench CanadianGermanGerman RussianGhanaianGreekGuamanian/ChamorroGuatemalanGuyaneseHaitianHmongHonduranHopiHoumaHungarianIcelanderIndian (Asian)IndonesianInupiatIranianIraqiIrishIroquoisIsraeliItalianJamaicanJapaneseJordanianKenyanKiowaKoreanLaotianLatvianLebaneseLiberianLithuanianLumbeeLuxembourgerMacedonianMalaysianMalteseMarshalleseMenomineeMexicanMexican American IndianMongolianMoroccanNative HawaiianNavajoNepaleseNew ZealanderNicaraguanNigerianNorthern EuropeanNorwegianOkinawanOsageOttawaPaiutePakistaniPalestinianPanamanianParaguayanPennsylvania GermanPeruvianPimaPolishPortuguesePotawatomiPuebloPuerto RicanPuget Sound SalishRomanianRussianSalvadoranSamoanScandinavianScotch-IrishScottishSeminoleSenegaleseSerbianShoshoneSierra LeoneanSiouxSlavicSlovakSloveneSomaliSouth AfricanSouth AmericanSouth American IndianSoviet UnionSpaniardSpanishSpanish AmericanSpanish American IndianSri LankanSubsaharan AfricanSudaneseSwedishSwissSyrianTaiwaneseThaiTlingit-HaidaTohono O'OdhamTonganTrinidadian and TobagonianTsimshianTurkishU.S. Virgin IslanderUgandanUkrainianUruguayanUteVenezuelanVietnameseWelshWest IndianYakamaYaquiYugoslavianYumanYup'ikZimbabwean
Immigration
NonimmigrantsImmigrantsAfghanistanAfricaAlbaniaArgentinaArmeniaAsiaAustraliaAustriaBahamasBangladeshBarbadosBelarusBelgiumBelizeBoliviaBosnia and HerzegovinaBrazilBulgariaBurma/MyanmarCabo VerdeCambodiaCameroonCanadaCaribbeanCentral AmericaChileChinaColombiaCongoCosta RicaCroatiaCubaCzechoslovakiaDenmarkDominicaDominican RepublicEastern AfricaEastern AsiaEastern EuropeEcuadorEgyptEl SalvadorEnglandEritreaEthiopiaEuropeFijiFranceGermanyGhanaGreeceGrenadaGuatemalaGuyanaHaitiHondurasHong KongIndiaIndonesiaIranIraqIrelandIsraelItalyJamaicaJapanJordanKazakhstanKenyaKoreaKuwaitLaosLatin AmericaLatviaLebanonLiberiaLithuaniaMalaysiaMexicoMicronesiaMiddle AfricaMoldovaMoroccoNepalNetherlandsNicaraguaNigeriaNorth AmericaNorth MacedoniaNorthern AfricaNorthern EuropeNorwayOceaniaPakistanPanamaPeruPhilippinesPolandPortugalRomaniaRussiaSaudi ArabiaScotlandSenegalSerbiaSierra LeoneSingaporeSomaliaSouth AfricaSouth AmericaSouth Central AsiaSouth Eastern AsiaSouthern EuropeSpainSri LankaSt. Vincent and the GrenadinesSudanSwedenSwitzerlandSyriaTaiwanThailandTrinidad and TobagoTurkeyUgandaUkraineUruguayUzbekistanVenezuelaVietnamWest IndiesWestern AfricaWestern AsiaWestern EuropeYemenZaireZimbabweAzores
Immigrants from Hungary
Race
Ancestry
AfghanAfricanAlaska NativeAlaskan AthabascanAlbanianAleutAlsatianAmericanApacheArabArapahoArgentineanArmenianAssyrian/Chaldean/SyriacAustralianAustrianBahamianBangladeshiBarbadianBasqueBelgianBelizeanBermudanBhutaneseBlackfeetBolivianBrazilianBritishBritish West IndianBulgarianBurmeseCajunCambodianCanadianCape VerdeanCarpatho RusynCelticCentral AmericanCentral American IndianCherokeeCheyenneChickasawChileanChineseChippewaChoctawColombianColvilleComancheCosta RicanCreeCreekCroatianCrowCubanCypriotCzechCzechoslovakianDanishDelawareDominicanDutchDutch West IndianEastern EuropeanEcuadorianEgyptianEnglishEstonianEthiopianEuropeanFijianFilipinoFinnishFrenchFrench American IndianFrench CanadianGermanGerman RussianGhanaianGreekGuamanian/ChamorroGuatemalanGuyaneseHaitianHmongHonduranHopiHoumaHungarianIcelanderIndian (Asian)IndonesianInupiatIranianIraqiIrishIroquoisIsraeliItalianJamaicanJapaneseJordanianKenyanKiowaKoreanLaotianLatvianLebaneseLiberianLithuanianLumbeeLuxembourgerMacedonianMalaysianMalteseMarshalleseMenomineeMexicanMexican American IndianMongolianMoroccanNative HawaiianNavajoNepaleseNew ZealanderNicaraguanNigerianNorthern EuropeanNorwegianOkinawanOsageOttawaPaiutePakistaniPalestinianPanamanianParaguayanPennsylvania GermanPeruvianPimaPolishPortuguesePotawatomiPuebloPuerto RicanPuget Sound SalishRomanianRussianSalvadoranSamoanScandinavianScotch-IrishScottishSeminoleSenegaleseSerbianShoshoneSierra LeoneanSiouxSlavicSlovakSloveneSomaliSouth AfricanSouth AmericanSouth American IndianSoviet UnionSpaniardSpanishSpanish AmericanSpanish American IndianSri LankanSubsaharan AfricanSudaneseSwedishSwissSyrianTaiwaneseThaiTlingit-HaidaTohono O'OdhamTonganTrinidadian and TobagonianTsimshianTurkishU.S. Virgin IslanderUgandanUkrainianUruguayanUteVenezuelanVietnameseWelshWest IndianYakamaYaquiYugoslavianYumanYup'ikZimbabwean
Immigration
NonimmigrantsImmigrantsAfghanistanAfricaAlbaniaArgentinaArmeniaAsiaAustraliaAustriaBahamasBangladeshBarbadosBelarusBelgiumBelizeBoliviaBosnia and HerzegovinaBrazilBulgariaBurma/MyanmarCabo VerdeCambodiaCameroonCanadaCaribbeanCentral AmericaChileChinaColombiaCongoCosta RicaCroatiaCubaCzechoslovakiaDenmarkDominicaDominican RepublicEastern AfricaEastern AsiaEastern EuropeEcuadorEgyptEl SalvadorEnglandEritreaEthiopiaEuropeFijiFranceGermanyGhanaGreeceGrenadaGuatemalaGuyanaHaitiHondurasHong KongHungaryIndiaIndonesiaIranIraqIrelandIsraelItalyJamaicaJapanKazakhstanKenyaKoreaKuwaitLaosLatin AmericaLatviaLebanonLiberiaLithuaniaMalaysiaMexicoMicronesiaMiddle AfricaMoldovaMoroccoNepalNetherlandsNicaraguaNigeriaNorth AmericaNorth MacedoniaNorthern AfricaNorthern EuropeNorwayOceaniaPakistanPanamaPeruPhilippinesPolandPortugalRomaniaRussiaSaudi ArabiaScotlandSenegalSerbiaSierra LeoneSingaporeSomaliaSouth AfricaSouth AmericaSouth Central AsiaSouth Eastern AsiaSouthern EuropeSpainSri LankaSt. Vincent and the GrenadinesSudanSwedenSwitzerlandSyriaTaiwanThailandTrinidad and TobagoTurkeyUgandaUkraineUruguayUzbekistanVenezuelaVietnamWest IndiesWestern AfricaWestern AsiaWestern EuropeYemenZaireZimbabweAzores
Bachelor's Degree
Income
Poverty
Unemployment
Labor Participation
Family Structure
Vehicle Availability
Education Level
Disability

Bachelor's Degree Comparison

Immigrants from Jordan

Immigrants from Hungary

Exceptional
Exceptional
40.3%
BACHELOR'S DEGREE
93.4/ 100
METRIC RATING
127th/ 347
METRIC RANK
42.3%
BACHELOR'S DEGREE
99.2/ 100
METRIC RATING
81st/ 347
METRIC RANK

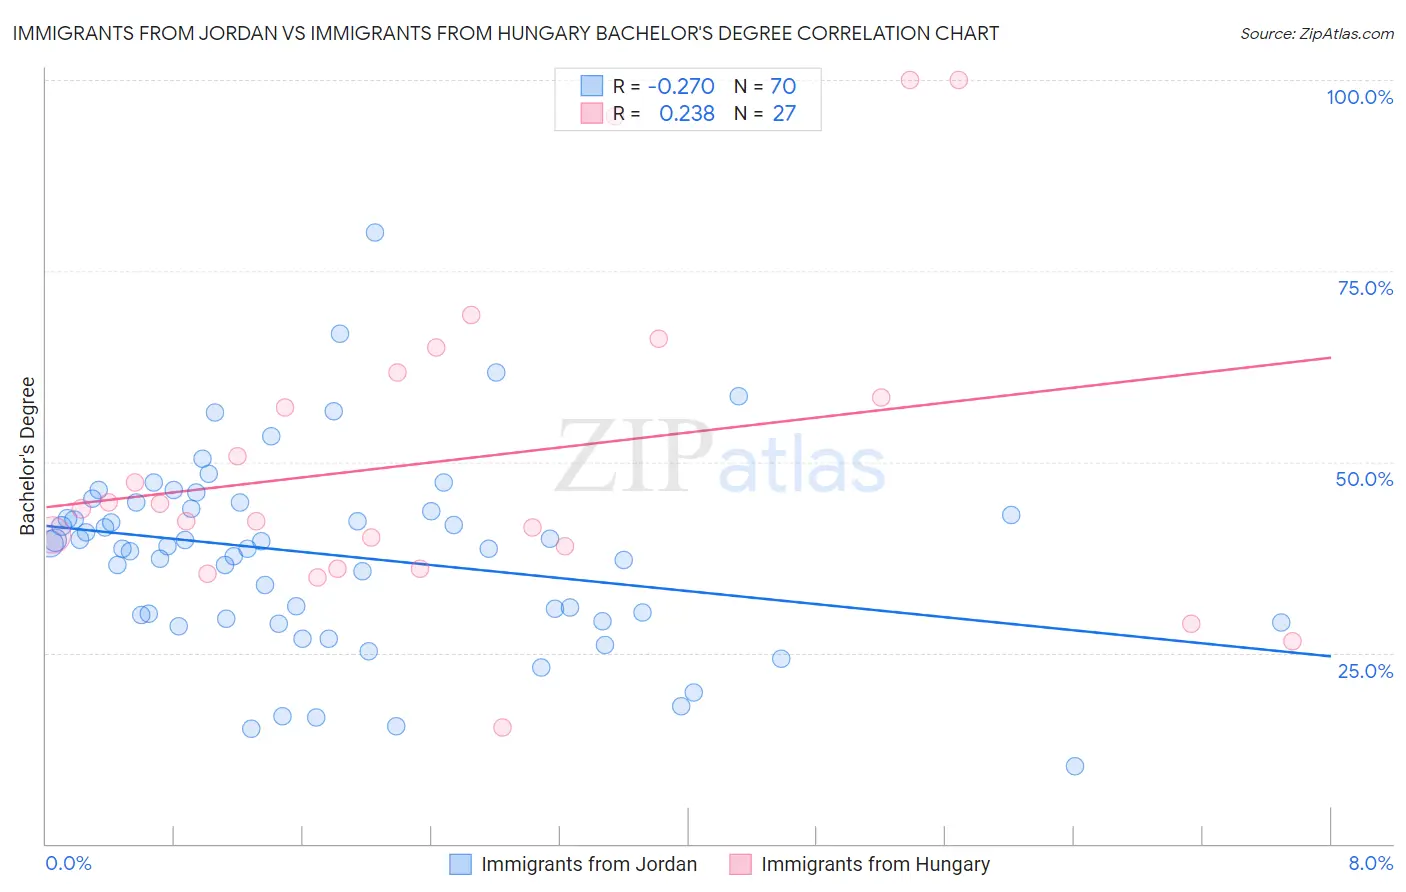
Immigrants from Jordan vs Immigrants from Hungary Bachelor's Degree Correlation Chart

The statistical analysis conducted on geographies consisting of 181,275,733 people shows a weak negative correlation between the proportion of Immigrants from Jordan and percentage of population with at least bachelor's degree education in the United States with a correlation coefficient (R) of -0.270 and weighted average of 40.3%. Similarly, the statistical analysis conducted on geographies consisting of 195,704,422 people shows a weak positive correlation between the proportion of Immigrants from Hungary and percentage of population with at least bachelor's degree education in the United States with a correlation coefficient (R) of 0.238 and weighted average of 42.3%, a difference of 5.1%.
Immigrants from Jordan vs Immigrants from Hungary Bachelor's Degree

Bachelor's Degree Correlation Summary

MeasurementImmigrants from JordanImmigrants from Hungary
Minimum10.2%15.2%
Maximum80.0%100.0%
Range69.8%84.8%
Mean37.8%50.5%
Median38.8%43.9%
Interquartile 25% (IQ1)29.5%36.1%
Interquartile 75% (IQ3)43.8%61.7%
Interquartile Range (IQR)14.3%25.6%
Standard Deviation (Sample)12.4%21.3%
Standard Deviation (Population)12.4%20.9%

Similar Demographics by Bachelor's Degree

Demographics Similar to Immigrants from Jordan by Bachelor's Degree

In terms of bachelor's degree, the demographic groups most similar to Immigrants from Jordan are Immigrants from Venezuela (40.2%, a difference of 0.17%), Immigrants from Eastern Africa (40.4%, a difference of 0.28%), British (40.4%, a difference of 0.33%), Serbian (40.1%, a difference of 0.35%), and Immigrants from Eritrea (40.4%, a difference of 0.36%).
DemographicsRating | RankBachelor's Degree
Venezuelans
94.7
/100
|
#120
Exceptional
40.5%
Moroccans
94.6
/100
|
#121
Exceptional
40.5%
Immigrants | Albania
94.4
/100
|
#122
Exceptional
40.4%
Lebanese
94.3
/100
|
#123
Exceptional
40.4%
Immigrants | Eritrea
94.3
/100
|
#124
Exceptional
40.4%
British
94.2
/100
|
#125
Exceptional
40.4%
Immigrants | Eastern Africa
94.1
/100
|
#126
Exceptional
40.4%
Immigrants | Jordan
93.4
/100
|
#127
Exceptional
40.3%
Immigrants | Venezuela
92.9
/100
|
#128
Exceptional
40.2%
Serbians
92.4
/100
|
#129
Exceptional
40.1%
Sierra Leoneans
92.2
/100
|
#130
Exceptional
40.1%
Italians
91.9
/100
|
#131
Exceptional
40.1%
Taiwanese
91.1
/100
|
#132
Exceptional
40.0%
Immigrants | Southern Europe
91.1
/100
|
#133
Exceptional
40.0%
Assyrians/Chaldeans/Syriacs
89.4
/100
|
#134
Excellent
39.8%

Demographics Similar to Immigrants from Hungary by Bachelor's Degree

In terms of bachelor's degree, the demographic groups most similar to Immigrants from Hungary are Immigrants from Croatia (42.3%, a difference of 0.020%), Immigrants from Scotland (42.3%, a difference of 0.070%), Armenian (42.3%, a difference of 0.10%), Immigrants from Western Asia (42.3%, a difference of 0.11%), and Lithuanian (42.2%, a difference of 0.14%).
DemographicsRating | RankBachelor's Degree
Bhutanese
99.5
/100
|
#74
Exceptional
42.7%
Immigrants | Zimbabwe
99.4
/100
|
#75
Exceptional
42.6%
Immigrants | Egypt
99.4
/100
|
#76
Exceptional
42.6%
Immigrants | Eastern Europe
99.4
/100
|
#77
Exceptional
42.5%
Immigrants | Ethiopia
99.4
/100
|
#78
Exceptional
42.5%
Immigrants | Lebanon
99.3
/100
|
#79
Exceptional
42.4%
Immigrants | Croatia
99.2
/100
|
#80
Exceptional
42.3%
Immigrants | Hungary
99.2
/100
|
#81
Exceptional
42.3%
Immigrants | Scotland
99.2
/100
|
#82
Exceptional
42.3%
Armenians
99.2
/100
|
#83
Exceptional
42.3%
Immigrants | Western Asia
99.2
/100
|
#84
Exceptional
42.3%
Lithuanians
99.2
/100
|
#85
Exceptional
42.2%
Immigrants | Brazil
99.2
/100
|
#86
Exceptional
42.2%
Carpatho Rusyns
99.0
/100
|
#87
Exceptional
42.1%
Immigrants | Western Europe
99.0
/100
|
#88
Exceptional
42.0%