Immigrants from Belarus vs Immigrants from Hungary Bachelor's Degree

COMPARE

Immigrants from Belarus
Race
Ancestry
AfghanAfricanAlaska NativeAlaskan AthabascanAlbanianAleutAlsatianAmericanApacheArabArapahoArgentineanArmenianAssyrian/Chaldean/SyriacAustralianAustrianBahamianBangladeshiBarbadianBasqueBelgianBelizeanBermudanBhutaneseBlackfeetBolivianBrazilianBritishBritish West IndianBulgarianBurmeseCajunCambodianCanadianCape VerdeanCarpatho RusynCelticCentral AmericanCentral American IndianCherokeeCheyenneChickasawChileanChineseChippewaChoctawColombianColvilleComancheCosta RicanCreeCreekCroatianCrowCubanCypriotCzechCzechoslovakianDanishDelawareDominicanDutchDutch West IndianEastern EuropeanEcuadorianEgyptianEnglishEstonianEthiopianEuropeanFijianFilipinoFinnishFrenchFrench American IndianFrench CanadianGermanGerman RussianGhanaianGreekGuamanian/ChamorroGuatemalanGuyaneseHaitianHmongHonduranHopiHoumaHungarianIcelanderIndian (Asian)IndonesianInupiatIranianIraqiIrishIroquoisIsraeliItalianJamaicanJapaneseJordanianKenyanKiowaKoreanLaotianLatvianLebaneseLiberianLithuanianLumbeeLuxembourgerMacedonianMalaysianMalteseMarshalleseMenomineeMexicanMexican American IndianMongolianMoroccanNative HawaiianNavajoNepaleseNew ZealanderNicaraguanNigerianNorthern EuropeanNorwegianOkinawanOsageOttawaPaiutePakistaniPalestinianPanamanianParaguayanPennsylvania GermanPeruvianPimaPolishPortuguesePotawatomiPuebloPuerto RicanPuget Sound SalishRomanianRussianSalvadoranSamoanScandinavianScotch-IrishScottishSeminoleSenegaleseSerbianShoshoneSierra LeoneanSiouxSlavicSlovakSloveneSomaliSouth AfricanSouth AmericanSouth American IndianSoviet UnionSpaniardSpanishSpanish AmericanSpanish American IndianSri LankanSubsaharan AfricanSudaneseSwedishSwissSyrianTaiwaneseThaiTlingit-HaidaTohono O'OdhamTonganTrinidadian and TobagonianTsimshianTurkishU.S. Virgin IslanderUgandanUkrainianUruguayanUteVenezuelanVietnameseWelshWest IndianYakamaYaquiYugoslavianYumanYup'ikZimbabwean
Immigration
NonimmigrantsImmigrantsAfghanistanAfricaAlbaniaArgentinaArmeniaAsiaAustraliaAustriaBahamasBangladeshBarbadosBelarusBelgiumBelizeBoliviaBosnia and HerzegovinaBrazilBulgariaBurma/MyanmarCabo VerdeCambodiaCameroonCanadaCaribbeanCentral AmericaChileChinaColombiaCongoCosta RicaCroatiaCubaCzechoslovakiaDenmarkDominicaDominican RepublicEastern AfricaEastern AsiaEastern EuropeEcuadorEgyptEl SalvadorEnglandEritreaEthiopiaEuropeFijiFranceGermanyGhanaGreeceGrenadaGuatemalaGuyanaHaitiHondurasHong KongIndiaIndonesiaIranIraqIrelandIsraelItalyJamaicaJapanJordanKazakhstanKenyaKoreaKuwaitLaosLatin AmericaLatviaLebanonLiberiaLithuaniaMalaysiaMexicoMicronesiaMiddle AfricaMoldovaMoroccoNepalNetherlandsNicaraguaNigeriaNorth AmericaNorth MacedoniaNorthern AfricaNorthern EuropeNorwayOceaniaPakistanPanamaPeruPhilippinesPolandPortugalRomaniaRussiaSaudi ArabiaScotlandSenegalSerbiaSierra LeoneSingaporeSomaliaSouth AfricaSouth AmericaSouth Central AsiaSouth Eastern AsiaSouthern EuropeSpainSri LankaSt. Vincent and the GrenadinesSudanSwedenSwitzerlandSyriaTaiwanThailandTrinidad and TobagoTurkeyUgandaUkraineUruguayUzbekistanVenezuelaVietnamWest IndiesWestern AfricaWestern AsiaWestern EuropeYemenZaireZimbabweAzores
Immigrants from Hungary
Race
Ancestry
AfghanAfricanAlaska NativeAlaskan AthabascanAlbanianAleutAlsatianAmericanApacheArabArapahoArgentineanArmenianAssyrian/Chaldean/SyriacAustralianAustrianBahamianBangladeshiBarbadianBasqueBelgianBelizeanBermudanBhutaneseBlackfeetBolivianBrazilianBritishBritish West IndianBulgarianBurmeseCajunCambodianCanadianCape VerdeanCarpatho RusynCelticCentral AmericanCentral American IndianCherokeeCheyenneChickasawChileanChineseChippewaChoctawColombianColvilleComancheCosta RicanCreeCreekCroatianCrowCubanCypriotCzechCzechoslovakianDanishDelawareDominicanDutchDutch West IndianEastern EuropeanEcuadorianEgyptianEnglishEstonianEthiopianEuropeanFijianFilipinoFinnishFrenchFrench American IndianFrench CanadianGermanGerman RussianGhanaianGreekGuamanian/ChamorroGuatemalanGuyaneseHaitianHmongHonduranHopiHoumaHungarianIcelanderIndian (Asian)IndonesianInupiatIranianIraqiIrishIroquoisIsraeliItalianJamaicanJapaneseJordanianKenyanKiowaKoreanLaotianLatvianLebaneseLiberianLithuanianLumbeeLuxembourgerMacedonianMalaysianMalteseMarshalleseMenomineeMexicanMexican American IndianMongolianMoroccanNative HawaiianNavajoNepaleseNew ZealanderNicaraguanNigerianNorthern EuropeanNorwegianOkinawanOsageOttawaPaiutePakistaniPalestinianPanamanianParaguayanPennsylvania GermanPeruvianPimaPolishPortuguesePotawatomiPuebloPuerto RicanPuget Sound SalishRomanianRussianSalvadoranSamoanScandinavianScotch-IrishScottishSeminoleSenegaleseSerbianShoshoneSierra LeoneanSiouxSlavicSlovakSloveneSomaliSouth AfricanSouth AmericanSouth American IndianSoviet UnionSpaniardSpanishSpanish AmericanSpanish American IndianSri LankanSubsaharan AfricanSudaneseSwedishSwissSyrianTaiwaneseThaiTlingit-HaidaTohono O'OdhamTonganTrinidadian and TobagonianTsimshianTurkishU.S. Virgin IslanderUgandanUkrainianUruguayanUteVenezuelanVietnameseWelshWest IndianYakamaYaquiYugoslavianYumanYup'ikZimbabwean
Immigration
NonimmigrantsImmigrantsAfghanistanAfricaAlbaniaArgentinaArmeniaAsiaAustraliaAustriaBahamasBangladeshBarbadosBelgiumBelizeBoliviaBosnia and HerzegovinaBrazilBulgariaBurma/MyanmarCabo VerdeCambodiaCameroonCanadaCaribbeanCentral AmericaChileChinaColombiaCongoCosta RicaCroatiaCubaCzechoslovakiaDenmarkDominicaDominican RepublicEastern AfricaEastern AsiaEastern EuropeEcuadorEgyptEl SalvadorEnglandEritreaEthiopiaEuropeFijiFranceGermanyGhanaGreeceGrenadaGuatemalaGuyanaHaitiHondurasHong KongHungaryIndiaIndonesiaIranIraqIrelandIsraelItalyJamaicaJapanJordanKazakhstanKenyaKoreaKuwaitLaosLatin AmericaLatviaLebanonLiberiaLithuaniaMalaysiaMexicoMicronesiaMiddle AfricaMoldovaMoroccoNepalNetherlandsNicaraguaNigeriaNorth AmericaNorth MacedoniaNorthern AfricaNorthern EuropeNorwayOceaniaPakistanPanamaPeruPhilippinesPolandPortugalRomaniaRussiaSaudi ArabiaScotlandSenegalSerbiaSierra LeoneSingaporeSomaliaSouth AfricaSouth AmericaSouth Central AsiaSouth Eastern AsiaSouthern EuropeSpainSri LankaSt. Vincent and the GrenadinesSudanSwedenSwitzerlandSyriaTaiwanThailandTrinidad and TobagoTurkeyUgandaUkraineUruguayUzbekistanVenezuelaVietnamWest IndiesWestern AfricaWestern AsiaWestern EuropeYemenZaireZimbabweAzores
Bachelor's Degree
Income
Poverty
Unemployment
Labor Participation
Family Structure
Vehicle Availability
Education Level
Disability

Bachelor's Degree Comparison

Immigrants from Belarus

Immigrants from Hungary

Exceptional
Exceptional
45.0%
BACHELOR'S DEGREE
100.0/ 100
METRIC RATING
40th/ 347
METRIC RANK
42.3%
BACHELOR'S DEGREE
99.2/ 100
METRIC RATING
81st/ 347
METRIC RANK

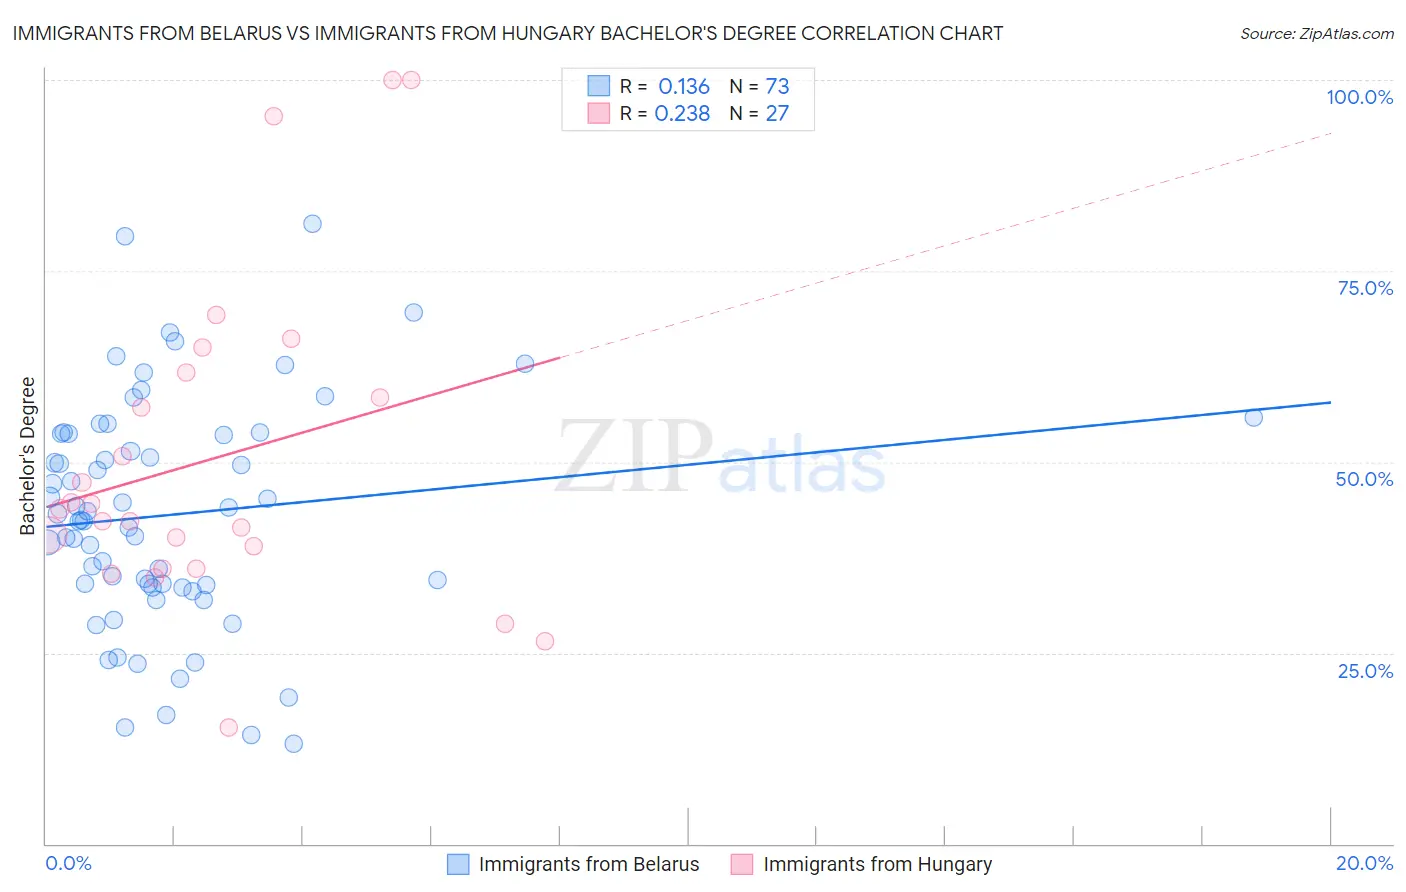
Immigrants from Belarus vs Immigrants from Hungary Bachelor's Degree Correlation Chart

The statistical analysis conducted on geographies consisting of 150,192,988 people shows a poor positive correlation between the proportion of Immigrants from Belarus and percentage of population with at least bachelor's degree education in the United States with a correlation coefficient (R) of 0.136 and weighted average of 45.0%. Similarly, the statistical analysis conducted on geographies consisting of 195,704,422 people shows a weak positive correlation between the proportion of Immigrants from Hungary and percentage of population with at least bachelor's degree education in the United States with a correlation coefficient (R) of 0.238 and weighted average of 42.3%, a difference of 6.4%.
Immigrants from Belarus vs Immigrants from Hungary Bachelor's Degree

Bachelor's Degree Correlation Summary

MeasurementImmigrants from BelarusImmigrants from Hungary
Minimum13.1%15.2%
Maximum81.2%100.0%
Range68.1%84.8%
Mean43.1%50.5%
Median42.3%43.9%
Interquartile 25% (IQ1)33.8%36.1%
Interquartile 75% (IQ3)53.7%61.7%
Interquartile Range (IQR)19.9%25.6%
Standard Deviation (Sample)14.8%21.3%
Standard Deviation (Population)14.7%20.9%

Similar Demographics by Bachelor's Degree

Demographics Similar to Immigrants from Belarus by Bachelor's Degree

In terms of bachelor's degree, the demographic groups most similar to Immigrants from Belarus are Immigrants from Malaysia (45.0%, a difference of 0.040%), Immigrants from Latvia (45.1%, a difference of 0.27%), Immigrants from Saudi Arabia (44.8%, a difference of 0.42%), Immigrants from South Africa (44.8%, a difference of 0.56%), and Bulgarian (45.3%, a difference of 0.60%).
DemographicsRating | RankBachelor's Degree
Immigrants | Northern Europe
100.0
/100
|
#33
Exceptional
45.6%
Immigrants | Denmark
100.0
/100
|
#34
Exceptional
45.4%
Immigrants | Russia
100.0
/100
|
#35
Exceptional
45.4%
Mongolians
100.0
/100
|
#36
Exceptional
45.4%
Russians
100.0
/100
|
#37
Exceptional
45.3%
Bulgarians
100.0
/100
|
#38
Exceptional
45.3%
Immigrants | Latvia
100.0
/100
|
#39
Exceptional
45.1%
Immigrants | Belarus
100.0
/100
|
#40
Exceptional
45.0%
Immigrants | Malaysia
100.0
/100
|
#41
Exceptional
45.0%
Immigrants | Saudi Arabia
100.0
/100
|
#42
Exceptional
44.8%
Immigrants | South Africa
99.9
/100
|
#43
Exceptional
44.8%
Immigrants | Lithuania
99.9
/100
|
#44
Exceptional
44.6%
Immigrants | Kuwait
99.9
/100
|
#45
Exceptional
44.6%
Immigrants | Bulgaria
99.9
/100
|
#46
Exceptional
44.6%
Bolivians
99.9
/100
|
#47
Exceptional
44.6%

Demographics Similar to Immigrants from Hungary by Bachelor's Degree

In terms of bachelor's degree, the demographic groups most similar to Immigrants from Hungary are Immigrants from Croatia (42.3%, a difference of 0.020%), Immigrants from Scotland (42.3%, a difference of 0.070%), Armenian (42.3%, a difference of 0.10%), Immigrants from Western Asia (42.3%, a difference of 0.11%), and Lithuanian (42.2%, a difference of 0.14%).
DemographicsRating | RankBachelor's Degree
Bhutanese
99.5
/100
|
#74
Exceptional
42.7%
Immigrants | Zimbabwe
99.4
/100
|
#75
Exceptional
42.6%
Immigrants | Egypt
99.4
/100
|
#76
Exceptional
42.6%
Immigrants | Eastern Europe
99.4
/100
|
#77
Exceptional
42.5%
Immigrants | Ethiopia
99.4
/100
|
#78
Exceptional
42.5%
Immigrants | Lebanon
99.3
/100
|
#79
Exceptional
42.4%
Immigrants | Croatia
99.2
/100
|
#80
Exceptional
42.3%
Immigrants | Hungary
99.2
/100
|
#81
Exceptional
42.3%
Immigrants | Scotland
99.2
/100
|
#82
Exceptional
42.3%
Armenians
99.2
/100
|
#83
Exceptional
42.3%
Immigrants | Western Asia
99.2
/100
|
#84
Exceptional
42.3%
Lithuanians
99.2
/100
|
#85
Exceptional
42.2%
Immigrants | Brazil
99.2
/100
|
#86
Exceptional
42.2%
Carpatho Rusyns
99.0
/100
|
#87
Exceptional
42.1%
Immigrants | Western Europe
99.0
/100
|
#88
Exceptional
42.0%