Immigrants from Japan vs South American College, 1 year or more
COMPARE
Immigrants from Japan
South American
College, 1 year or more
College, 1 year or more Comparison
Immigrants from Japan
South Americans
66.7%
COLLEGE, 1 YEAR OR MORE
100.0/ 100
METRIC RATING
16th/ 347
METRIC RANK
59.0%
COLLEGE, 1 YEAR OR MORE
35.9/ 100
METRIC RATING
185th/ 347
METRIC RANK
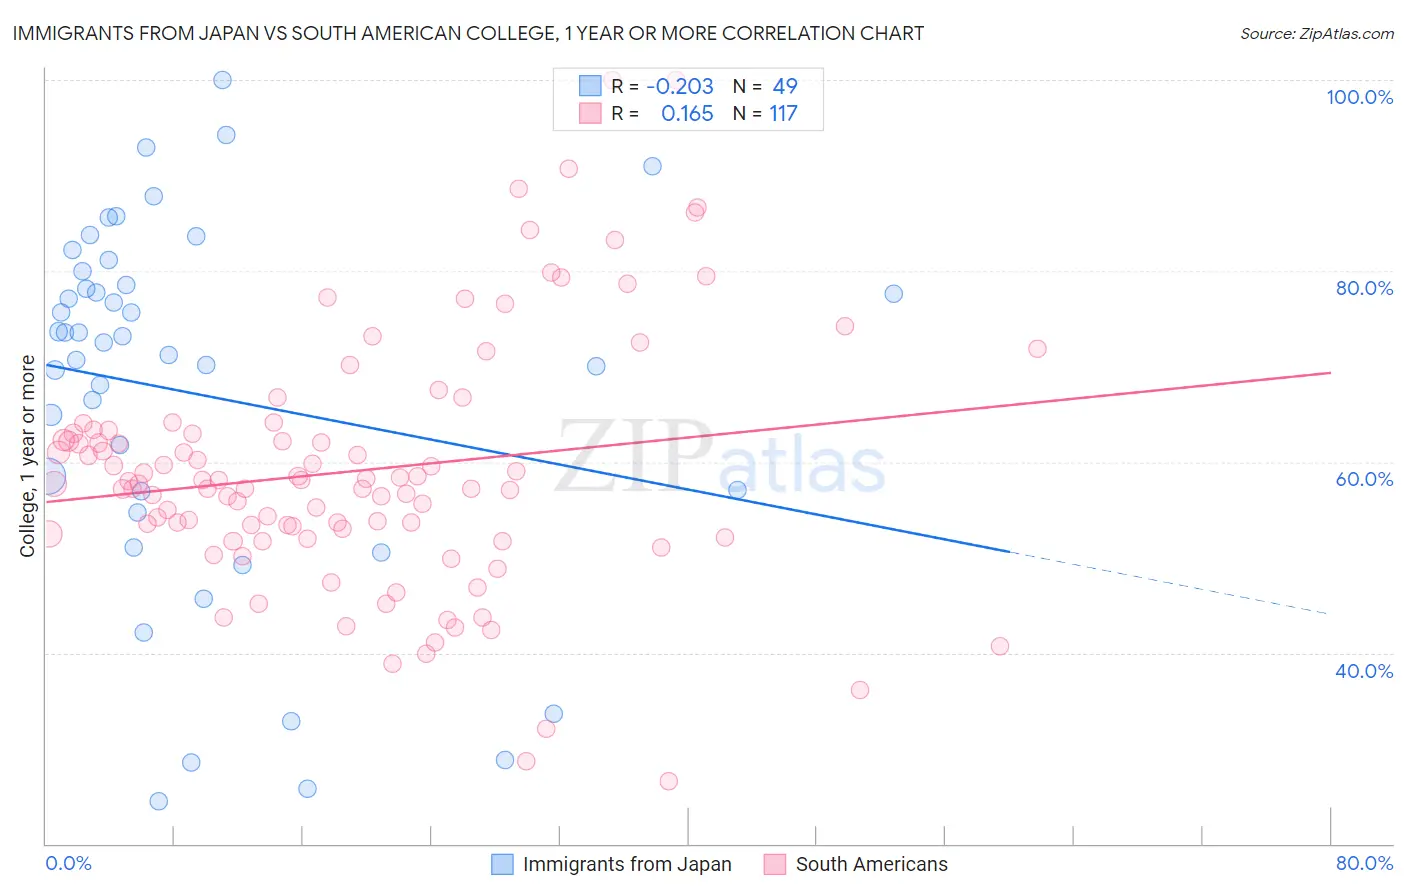
Immigrants from Japan vs South American College, 1 year or more Correlation Chart
The statistical analysis conducted on geographies consisting of 340,147,719 people shows a weak negative correlation between the proportion of Immigrants from Japan and percentage of population with at least college, 1 year or more education in the United States with a correlation coefficient (R) of -0.203 and weighted average of 66.7%. Similarly, the statistical analysis conducted on geographies consisting of 494,172,173 people shows a poor positive correlation between the proportion of South Americans and percentage of population with at least college, 1 year or more education in the United States with a correlation coefficient (R) of 0.165 and weighted average of 59.0%, a difference of 13.1%.
College, 1 year or more Correlation Summary
| Measurement | Immigrants from Japan | South American |
| Minimum | 24.4% | 26.5% |
| Maximum | 100.0% | 100.0% |
| Range | 75.6% | 73.5% |
| Mean | 67.0% | 59.1% |
| Median | 72.5% | 57.8% |
| Interquartile 25% (IQ1) | 55.8% | 52.2% |
| Interquartile 75% (IQ3) | 79.2% | 63.1% |
| Interquartile Range (IQR) | 23.4% | 10.9% |
| Standard Deviation (Sample) | 19.1% | 13.2% |
| Standard Deviation (Population) | 18.9% | 13.2% |
Similar Demographics by College, 1 year or more
Demographics Similar to Immigrants from Japan by College, 1 year or more
In terms of college, 1 year or more, the demographic groups most similar to Immigrants from Japan are Cambodian (66.7%, a difference of 0.030%), Burmese (66.7%, a difference of 0.040%), Immigrants from Eastern Asia (66.6%, a difference of 0.11%), Eastern European (66.6%, a difference of 0.19%), and Immigrants from Sweden (66.8%, a difference of 0.23%).
| Demographics | Rating | Rank | College, 1 year or more |
| Immigrants | Israel | 100.0 /100 | #9 | Exceptional 67.8% |
| Immigrants | Australia | 100.0 /100 | #10 | Exceptional 67.7% |
| Immigrants | South Central Asia | 100.0 /100 | #11 | Exceptional 67.1% |
| Cypriots | 100.0 /100 | #12 | Exceptional 67.0% |
| Immigrants | Sweden | 100.0 /100 | #13 | Exceptional 66.8% |
| Burmese | 100.0 /100 | #14 | Exceptional 66.7% |
| Cambodians | 100.0 /100 | #15 | Exceptional 66.7% |
| Immigrants | Japan | 100.0 /100 | #16 | Exceptional 66.7% |
| Immigrants | Eastern Asia | 100.0 /100 | #17 | Exceptional 66.6% |
| Eastern Europeans | 100.0 /100 | #18 | Exceptional 66.6% |
| Immigrants | Switzerland | 100.0 /100 | #19 | Exceptional 66.5% |
| Immigrants | Korea | 100.0 /100 | #20 | Exceptional 66.5% |
| Immigrants | Hong Kong | 100.0 /100 | #21 | Exceptional 66.4% |
| Soviet Union | 100.0 /100 | #22 | Exceptional 66.4% |
| Immigrants | China | 100.0 /100 | #23 | Exceptional 66.4% |
Demographics Similar to South Americans by College, 1 year or more
In terms of college, 1 year or more, the demographic groups most similar to South Americans are Scotch-Irish (58.9%, a difference of 0.070%), German (58.9%, a difference of 0.070%), French (58.9%, a difference of 0.090%), Spaniard (59.0%, a difference of 0.14%), and German Russian (59.1%, a difference of 0.20%).
| Demographics | Rating | Rank | College, 1 year or more |
| Czechoslovakians | 48.3 /100 | #178 | Average 59.4% |
| Bermudans | 46.6 /100 | #179 | Average 59.3% |
| Yugoslavians | 44.1 /100 | #180 | Average 59.2% |
| Swiss | 43.4 /100 | #181 | Average 59.2% |
| Immigrants | Bosnia and Herzegovina | 42.8 /100 | #182 | Average 59.2% |
| German Russians | 39.3 /100 | #183 | Fair 59.1% |
| Spaniards | 38.3 /100 | #184 | Fair 59.0% |
| South Americans | 35.9 /100 | #185 | Fair 59.0% |
| Scotch-Irish | 34.7 /100 | #186 | Fair 58.9% |
| Germans | 34.7 /100 | #187 | Fair 58.9% |
| French | 34.4 /100 | #188 | Fair 58.9% |
| Uruguayans | 31.8 /100 | #189 | Fair 58.8% |
| Immigrants | Cameroon | 31.2 /100 | #190 | Fair 58.8% |
| Immigrants | Philippines | 29.2 /100 | #191 | Fair 58.7% |
| Colombians | 27.6 /100 | #192 | Fair 58.7% |