Immigrants from Japan vs Immigrants from West Indies 7th Grade
COMPARE
Immigrants from Japan
Immigrants from West Indies
7th Grade
7th Grade Comparison
Immigrants from Japan
Immigrants from West Indies
96.5%
7TH GRADE
95.5/ 100
METRIC RATING
118th/ 347
METRIC RANK
94.8%
7TH GRADE
0.0/ 100
METRIC RATING
292nd/ 347
METRIC RANK
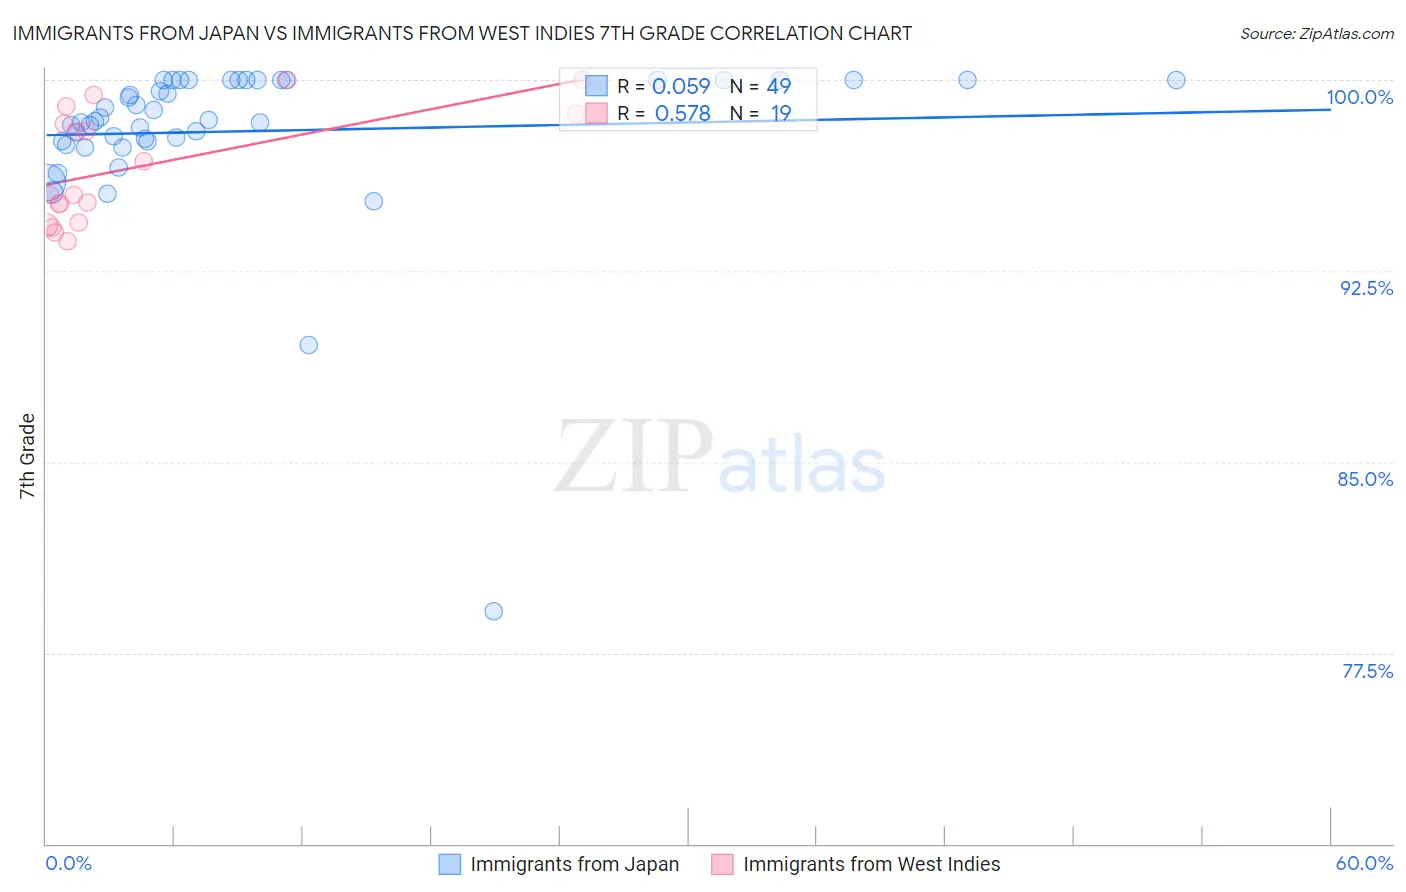
Immigrants from Japan vs Immigrants from West Indies 7th Grade Correlation Chart
The statistical analysis conducted on geographies consisting of 340,148,942 people shows a slight positive correlation between the proportion of Immigrants from Japan and percentage of population with at least 7th grade education in the United States with a correlation coefficient (R) of 0.059 and weighted average of 96.5%. Similarly, the statistical analysis conducted on geographies consisting of 72,457,514 people shows a substantial positive correlation between the proportion of Immigrants from West Indies and percentage of population with at least 7th grade education in the United States with a correlation coefficient (R) of 0.578 and weighted average of 94.8%, a difference of 1.8%.
7th Grade Correlation Summary
| Measurement | Immigrants from Japan | Immigrants from West Indies |
| Minimum | 79.1% | 93.7% |
| Maximum | 100.0% | 100.0% |
| Range | 20.9% | 6.3% |
| Mean | 98.0% | 96.6% |
| Median | 98.4% | 95.5% |
| Interquartile 25% (IQ1) | 97.6% | 94.4% |
| Interquartile 75% (IQ3) | 100.0% | 98.7% |
| Interquartile Range (IQR) | 2.4% | 4.2% |
| Standard Deviation (Sample) | 3.3% | 2.2% |
| Standard Deviation (Population) | 3.3% | 2.1% |
Similar Demographics by 7th Grade
Demographics Similar to Immigrants from Japan by 7th Grade
In terms of 7th grade, the demographic groups most similar to Immigrants from Japan are Immigrants from Moldova (96.5%, a difference of 0.010%), Immigrants from Norway (96.5%, a difference of 0.010%), Immigrants from Croatia (96.5%, a difference of 0.010%), Cheyenne (96.5%, a difference of 0.020%), and Immigrants from Europe (96.5%, a difference of 0.020%).
| Demographics | Rating | Rank | 7th Grade |
| Immigrants | Latvia | 97.4 /100 | #111 | Exceptional 96.6% |
| Immigrants | Nonimmigrants | 97.0 /100 | #112 | Exceptional 96.5% |
| Pueblo | 96.8 /100 | #113 | Exceptional 96.5% |
| Immigrants | Zimbabwe | 96.6 /100 | #114 | Exceptional 96.5% |
| Choctaw | 96.6 /100 | #115 | Exceptional 96.5% |
| Syrians | 96.6 /100 | #116 | Exceptional 96.5% |
| Immigrants | Moldova | 95.7 /100 | #117 | Exceptional 96.5% |
| Immigrants | Japan | 95.5 /100 | #118 | Exceptional 96.5% |
| Immigrants | Norway | 95.2 /100 | #119 | Exceptional 96.5% |
| Immigrants | Croatia | 95.0 /100 | #120 | Exceptional 96.5% |
| Cheyenne | 94.9 /100 | #121 | Exceptional 96.5% |
| Immigrants | Europe | 94.8 /100 | #122 | Exceptional 96.5% |
| Immigrants | France | 94.7 /100 | #123 | Exceptional 96.5% |
| Immigrants | Switzerland | 94.5 /100 | #124 | Exceptional 96.5% |
| Immigrants | Bulgaria | 94.0 /100 | #125 | Exceptional 96.4% |
Demographics Similar to Immigrants from West Indies by 7th Grade
In terms of 7th grade, the demographic groups most similar to Immigrants from West Indies are Immigrants from Grenada (94.8%, a difference of 0.020%), Fijian (94.7%, a difference of 0.020%), Malaysian (94.8%, a difference of 0.060%), Taiwanese (94.8%, a difference of 0.080%), and British West Indian (94.8%, a difference of 0.090%).
| Demographics | Rating | Rank | 7th Grade |
| Immigrants | Eritrea | 0.1 /100 | #285 | Tragic 94.9% |
| Immigrants | Philippines | 0.0 /100 | #286 | Tragic 94.9% |
| Immigrants | Peru | 0.0 /100 | #287 | Tragic 94.9% |
| British West Indians | 0.0 /100 | #288 | Tragic 94.8% |
| Taiwanese | 0.0 /100 | #289 | Tragic 94.8% |
| Malaysians | 0.0 /100 | #290 | Tragic 94.8% |
| Immigrants | Grenada | 0.0 /100 | #291 | Tragic 94.8% |
| Immigrants | West Indies | 0.0 /100 | #292 | Tragic 94.8% |
| Fijians | 0.0 /100 | #293 | Tragic 94.7% |
| Haitians | 0.0 /100 | #294 | Tragic 94.7% |
| Yaqui | 0.0 /100 | #295 | Tragic 94.6% |
| Cubans | 0.0 /100 | #296 | Tragic 94.6% |
| Immigrants | South Eastern Asia | 0.0 /100 | #297 | Tragic 94.5% |
| Indonesians | 0.0 /100 | #298 | Tragic 94.5% |
| Bangladeshis | 0.0 /100 | #299 | Tragic 94.5% |